Welcome to the wind farm. We talk baseball round these parts.

 Get it? SABERmetrics? ...Please? Can I at least get a golf clap or a pity laugh? I decided that I'd make a post as a key of sorts for all of the different stats I'll be making use of in Persons of Interest and other miscellaneous nerdposts. It's a neat guide with everything in one place. This will save me the time of explaining things in later posts. Batting StatsLaunch angle: the degree angle at which the ball leaves the bat after contact is made. The higher the launch angle, the higher in the air the ball is getting struck. Exit velocity: the speed at which the ball leaves the bat after contact is made. Harder contact is better contact. Hard hit rate: the rate of batted balls a player has hit that exceed a 95 mph exit velocity. Elite hitters in this regard like Aaron Judge and J.D. Martinez will likely have a hard hit rate around 50% by the end of a full season. The average hitter's hard hit rate in 2018 was about 37%. Barrel: the ideal combination of launch angle and exit velocity. Barreled hits are the most valuable hits you can have, because they are highly likely to not only be hits, but extra base hits. wOBA: weighted on base average. This stat is like OBP, but it does not create all methods of reaching base equal. It's intuitive; home runs are more valuable than mere singles. In a way it's an eldritch hybrid of slugging and on base. It works well for determining who is contributing the most overall offensively. This stat actually works for pitchers as well, but for them, a pitcher's wOBA is what opposing hitters' wOBA is AGAINST them. xwOBA: expected weighted on base average. This is wOBA with one extra step to it. It's what a hitter's wOBA is expected to be when taking exit velocity, launch angle and other quality of contact information into account. For example, on May 16th, in a game between the Cardinals and Braves, Dexter Fowler hit a fly ball off Touki Toussaint at 101.5 mph and a 24 degree exit velocity. It was a barrel. Balls hit like that have an expected batting average of .730. But then Ronald Acuña caught it in center field for a loud out. Despite this fact, xwOBA gives Fowler credit for the batted ball because of how likely it was to be a hit. This stat works for pitchers too, but it's what opposing hitters' xwOBA is against said pitcher. wRC+: weighted runs created plus. A stat that seeks to give the hitter credit for the value of each plate appearance outcome (similarly to wOBA, they're weighted differently), while also removing the effects of ballpark and hitting environment. The stat is scaled in such a way so that, year after year, the league average is 100. Anything above 100 is above average, and everything below 100 is below average. This makes the stat easy to use. Baseball Reference has a similar stat called OPS+ which works very similarly. Either is acceptable, I just kind of got used to using wRC+. BABIP: batting average on balls in play. A predictive stat. What a hitter's batting average is expected to be if you took away strikeouts, walks, or any other plate appearance result that doesn't involve making contact. This is a good gauge for if a player is hitting into particularly good or bad luck. If a player's BABIP is atmospherically high, you can safely assume that they're getting more than a little bit lucky. An example of low and high BABIPs from last year: Mallex Smith hit .296/.367/.406, but had a .367 BABIP. Hit into some good luck. Carlos Santana hit .229/.352/.414 last year, which is fine, but his .231 BABIP suggests that he was quite unlucky and could've done even better. Fielding StatsDRS: defensive runs saved. A defensive metric that judges a player's defensive ability based on the probability of plays they make or don't make. You'll get bonus points for making plays that are tough, and you'll get points taken away for muffing routine plays. How do they calculate these bonus points? By calculating the probability that a play is made based on batted ball information and the distance needed for a fielder to make a successful play. The leader in DRS last year in any position was Matt Chapman, who took home the Platinum Glove for most outstanding defensive player. He had 29 defensive runs saved. UZR: ultimate zone rating. Same concept as DRS, but with a slightly different nerd formula. DRS is also formatted as an integer, whereas UZR employs a scary decimal point. Angels shortstop Andrelton Simmons' UZR of 19.7 was the highest in the league in 2018. Basically, DRS and UZR are what keep defensive players honest. OAA: outs above average. This stat is currently only available for outfielders, but it's a valuable tool for judging said outfielders' defensive ability, so I'll include it. It works off catch probability, which is rather self explanatory. Well, OAA takes the catch probabilities of all batted balls a fielder attempts to make a play on and quantifies how valuable the outfielder is on the plays they make or don't make. I'll use an example I've used before: this catch from Byron Buxton. (Well, you'll have to watch it on YouTube because MLB is stupid with their copyright, but...) So a batted ball like the one Christin Stewart hit has an xBA of .940: in other words, a 94% hit probability. If Buxton makes the catch, which he does, it adds 0.94 outs to his total. If he doesn't make the catch, he is dinged by a very insignificant 0.06 points. The outs above average stat is rounded to the nearest integer, similarly to DRS. In 2018, the outfielder with the highest outs above average was the Brewers' Lorenzo Cain, with 22. The Braves' Ender Inciarte was second with 21, and Harrison Bader of the Cardinals rounded out the top three with 19. Pitching StatsFIP: fielding independent pitching. What a pitcher's ERA would be when focusing on results that defense does not affect (strikeouts, walks, HBPs, home runs allowed). Similarly to BABIP, it is predictive of future performance. Phillies pitcher Nick Pivetta recorded an ERA of 4.77, but his 3.80 FIP indicated that he was dinged by outcomes that were out of his control. Ergo, his defense was likely somewhat to blame. Indeed, in 2018, the Phillies' defense was far and away the worst in baseball. Check out the rankings of the teams by defensive runs saved in reverse order. 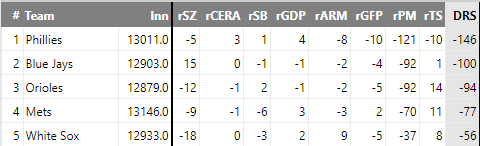 Yeah, not great. With that in mind it seemed like a shoo-in that with an overhauled roster that was more defensively stalwart, Nick Pivetta would break out. Unfortunately, that hasn't happened yet, as he surrendered an ERA of 8.35 in 4 starts before being sent down to the Minors. Analytics aren't flawless, folks. If you're morbidly curious about Pivetta's FIP this year, it's 6.38. Apparently "more defensively stalwart" was a bit of a misconception. xFIP: expected fielding independent pitching. This stat should be put to use more often. I don't think I need to get into the gritty details about this one; you know FIP, you know how expected stats work by now. One thing that you need to know that sets xFIP apart from FIP is that they treat home runs differently. Note the highlighted passage in the following image which explains the stat. 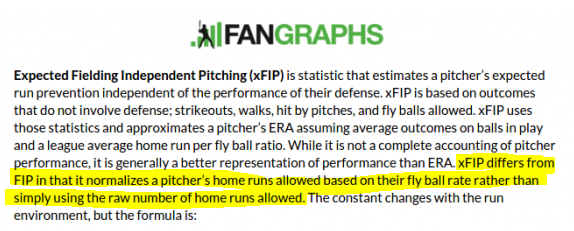 ...Don't worry about the formula. Let's just go back to poor Nick Pivetta. Because, by xFIP's estimation, he got a rawer deal both last year and this year than we anticipated. In 2018, his xFIP was 3.42, which is really damn solid. Then, this year, where he's bottomed out and now sits in Lehigh Valley, probably very bored? He merely had an xFIP of 4.77, HIS ERA FROM 2018. It's not by any means good, but remember: his ERA was upwards of 8. Poor Nick Pivetta. Here's hoping he figures something out in Lehigh Valley. He's already doing rather well there. ERA-: earned run average minus. This is a rather obscure one and it isn't all that intuitive. It's basically supposed to be like wRC+ for pitchers, but instead anything below 100 is above average and anything above 100 is below average. For example, Jacob deGrom had an ERA- last year of 45. Remember, average is 100 and anything below it is good. That's crazy. Now, like I said, it's a bit counterintuitive. If you think of it the same way as ERA and FIP, where a lower number is better, it shouldn't confuse you too much, but I think there are easier ways to quantify pitcher performance that conform more closely to your standard ERA. I might use this on occasion though because it's kinda neat. Just putting this in here to alert you to its existence. FIP-: fielding independent pitching minus. Similar song and dance to ERA-, but with the whole "just worry about what you can control" blanket thrown on it. Pivetta, our FIP champion, had a FIP- of 92, eking out an above average mark there despite an ERA- of 119. Now, again, this stat is pretty neat and I like that it exists, but it won't be my go-to for judging pitcher performance. Maybe if there's a standout in this particular stat I'll include it. And, last but not least...WAR: wins above replacement. How many more games a team would win with this player on the roster. Over a full season...
Thanks for reading! Hope this helped!
0 Comments
Leave a Reply. |
About MeI'm Jeremy, and I like baseball. Watching it and writing about it mainly. This is where the latter goes. My other hobbies include video games, singing, biking, and slacking off. I live in New Jersey and go to school at Goucher College in Baltimore. 
That's me on TV! If you want a better look, check out this video. Watch the stands on Kyle Lewis' home run very closely. Look for the skinny guy with the Yankees hat.
Archives
June 2020
Categories |
 RSS Feed
