Welcome to the wind farm. We talk baseball round these parts.

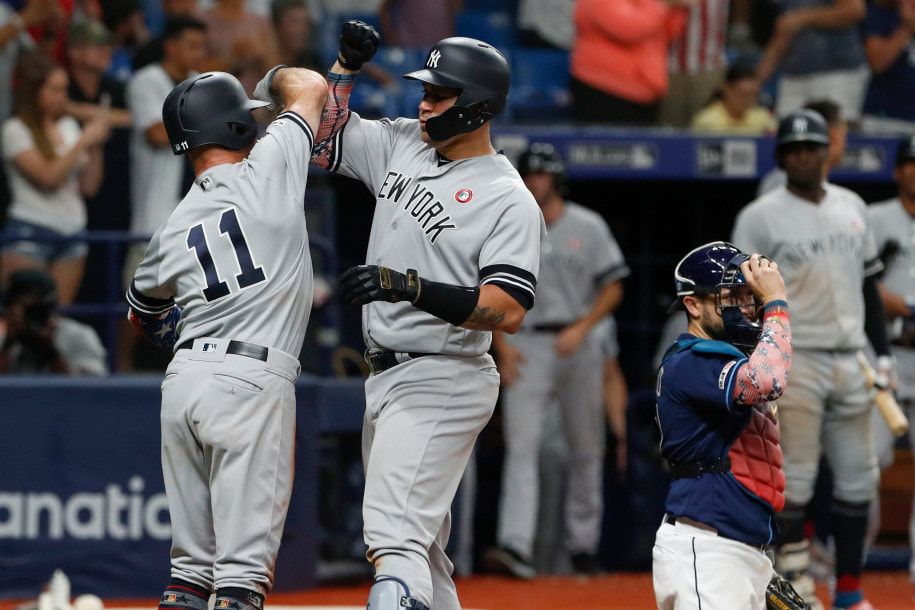 Gary Sanchez and Brett Gardner (11) celebrate after Sanchez hit a 3-run home run in the 10th inning of Wednesday's game between the Yankees and the Rays. The Yankees' success against their divisional rivals have been pivotal in building a commanding division lead. Tonight, the New York Yankees defeated the Tampa Bay Rays 8-4 in 11 innings. This marks the Yankees' 11th consecutive win over AL East teams. Overall, the Bombers sport a 29-7 (.806) mark against their division foes, the best division record of any team in the league. This may not seem overly impressive: the Orioles and Jays are pushovers, the Red Sox are weaker than last year's iteration, and the Rays, while good, have stalled offensively. But "impressive" and "important" are two very different things, and among all the games a team plays in a season, the divisional matchups are the most important. Sometimes, they directly influence divisional races.
Let's look at last year's AL East, for example. The 2018 Red Sox, en route to a World Series title, posted a 52-24 record against AL East foes. Nearly half of their franchise-record 108 regular season wins came against their division rivals. The Yankees, who finished in second place and earned the first Wild Card spot, finished 44-32. This is an 8-game gap between the Red Sox' record and the Yankees' record. The Boston Red Sox won the AL East in 2018...by 8 games. Now back to this year's AL East landscape. The Yankees, as of tonight's win, hold an 8.5 game lead over the Rays. Remember, the Yankees are 29-7 against the divsion. The Rays are 17-16. While not as perfect of a fit in the frame as last year's divisional picture, it's clear that divisional play has heavily impacted the Yankees' and Rays' chances. Of course, this idea mostly applies to teams that have legitimate intra-division competition which, in this league, can honestly be said about every division in MLB right now. Every division has more than one team above .500. But for the sake of argument, let's take the 2018 Cleveland Indians, who played in a farcical division. Three tanking teams and one mediocrity were simply there for Cleveland to send them up the draft board and farm meaningless victories before they were swept at the hands of a juggernaut in Houston. These Indians went 49-27 against the AL Central division. They were 42-44 against everybody else. In addition, they went 23-31 against teams with a winning percentage at or above .500. So, yes, context matters. But this year will show the importance of beating your division. As of July 4th, 17 teams were at .500 or higher. For a league that has been criticized for having too many tanking teams, that's a triumph. And there are plenty of divisional battles being waged. Just look at the NL Central this year. No team is out of it. The Cubs, Brewers, Cardinals, Pirates, and Reds could ALL finish in either first or last. THAT will be a fun division upon which to look back and test this idea again at season's end. Once the smoke has cleared on THAT divisional battle, we'll see if I'm full of baloney, or if I'm on to something. I probably won't admit that I'm wrong either way. Thanks for reading! I really want to keep writing, and I think shorter, less stat-intensive pieces like this will really help keep my fires burning and my fingers moving. Be sure to let me know what you think either via the comment system that apparently does exist (I dunno how to work it though, you're on your own) or on Twitter @BlockIslandBall.
0 Comments
 The voting for the 2019 MLB All-Star Game has reached the finalist stage. Plenty of deserving candidates were submitted, and others snubbed, to reach this point. But this is what matters. Every position has just a few names left to choose from. Armed with Statcast numbers from Baseball Savant (and some occasional help from Fangraphs), I'll show you which players deserve your vote. Of course, all the big market teams are gonna win the votes anyway, but hey, it's the thought that counts. AL 1B: Luke Voit (NYY) vs. Carlos Santana (CLE) vs. C.J. Cron (MIN)
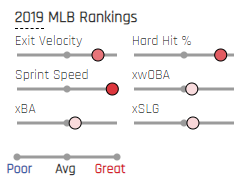
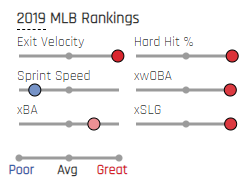
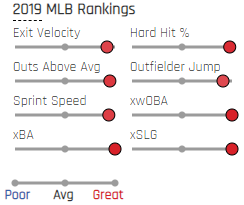
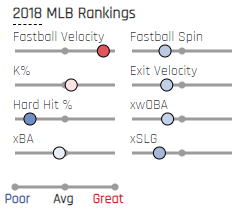
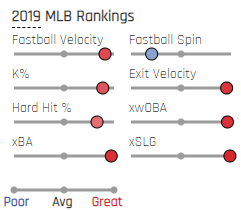
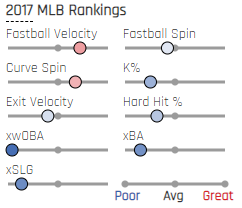
This race is a game of inches that ultimately leaves Luke Voit on the outside looking in. I am a hotblooded Yankees fan, but I can't be biased. For as well as he has performed this year (.378 wOBA, .379 xwOBA, .508 xSLG) after last year's coming out party, those metrics aren't quite at the same level as the other two first basemen on this list. Santana is back in Cleveland where it appears he belongs and putting together a career year. He's slashing just about .300/.400/.500, and advanced stats love him too. Not only does he destroy the baseball (95th percentile exit velo and 88th percentile hard hit rate), his expected stats also shine bright (.405 wOBA, .394 xwOBA, .519 xSLG). C.J. Cron is one of the biggest contributors to a power surge the Minnesota Twins have never seen before in their franchise's history. His obscenely high .568 xSLG certainly portrays the raw power he has displayed. He's also put together a .370 wOBA and .393 xwOBA. Verdict: It's hard to go wrong picking either Santana or Cron, but let's be real. Regular stats matter too. And in terms of OPS, Santana (.951) is outpacing Cron (.871) by 80 points. Their Statcast metrics are comparable enough that sometimes, a good ol' tiebreaker using good ol' comprehensible stats works well enough. Winner: Carlos Santana NL 1B: Josh Bell (PIT) vs. Freddie Freeman (ATL) vs. Anthony Rizzo (CHC)
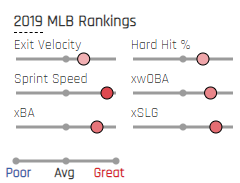
Josh Bell is a blast to watch. He has broken out in a big way this year, his third full year in the bigs. He is the big challenger among these finalists, taking on the two most recognized first basemen in the league. He certainly has good reason to be considered. He sports a 1.013 OPS. His hard hit rate and average exit velocity rank within the top 10 of the entire league. He also sports a wOBA of .416, an xwOBA of .391 and an xSLG of .572, all decidedly elite marks. He punishes baseballs. Meanwhile, in the AL East, Freddie Freeman is once again quietly compiling another fantastic season. One of the greatest contact hitters of our generation, Freeman is approaching a 1.000 OPS while hitting the tar out of baseballs. His hard hit numbers don't compare as well as Josh Bell's, but he triumphs in a slightly more important area: xwOBA. His .418 xwOBA ranks 5th in the NL behind Cody Bellinger, Anthony Rendon (criminally snubbed), Christian Yelich and...Howie Kendrick? (Remind me to write about Howie Kendrick...) He also has an edge in terms of WAR (Freeman - 2.8 WAR, Bell - 2.3 WAR, Rizzo - 2 WAR according to Fangraphs). Freeman is the perfect combo of on-base and contact skills. It's hard to find a more complete hitter, especially at first base. Finally, Anthony Rizzo. He can't claim to be as proficient at destroying baseballs as the others, but he still has a very impressive .390 wOBA, .400 xwOBA, and .526 xSLG. But those stats, as great as they are, fall behind Bell's xSLG and Freeman's xwOBA. Verdict: Freeman has no weaknesses. Bell hasn't really had any either, but Freeman's better on-base numbers push him over the top. Winner: Freddie Freeman AL 2B: Jose Altuve (HOU) vs. Tommy La Stella (LAA) vs. DJ LeMahieu (NYY)
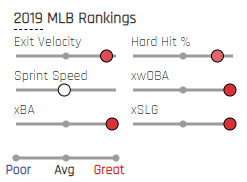
I'll be quick and blunt. Jose Altuve doesn't belong here. Not only has he only amassed 192 plate appearances (compared to 290 for La Stella and 331 for LeMahieu), his play has been far below Altuve's standard over the years (blame injuries for that) and hardly All-Star worthy. La Stella, meanwhile, has far exceeded his standards from previous seasons and has solidly entrenched himself as a starting-caliber infielder for the Angels. He's played more this year than any year in his career, and his xwOBA of .355 and xSLG of .471 are career highs. He's a soft contact guy, but it's working well for him, and his xBA is way up there too. But DJ LeMahieu. Hoo boy. I was wrong about this guy. He is everything the Yankees could've possibly hoped for as a free agent acquisition. He hits the ball hard, constantly reaches base, and is recently finding his power stroke. His xBA of .309, xwOBA of .383 and xSLG of .485 outclass the rest. He's also one of the best clutch/situational hitters in the game. He has an OPS of 1.195 with runners in scoring position. Verdict: LeMahieu is just too consistently good at reaching and producing to not be the choice here. Altuve hasn't played enough, and La Stella, while being a pleasant surprise, doesn't match DJ's production. Winner: DJ LeMahieu NL 2B: Ozzie Albies (ATL) vs. Ketel Marte (ARI) vs. Mike Moustakas (MIL)
Ozzie Albies, the diminutive but affable and capable infielder for the Braves, enters the ring. He won't hit the ball hard, but he is fast, opportunistic, and well-rounded. He's a decidedly old-fashioned infielder in a sport that values power. He's been effective, with a .362 xwOBA and .490 xSLG. But is it All-Star caliber? Honestly, not really, with respect to his opponents in this race. Ketel Marte of the Diamondbacks is a name not too many people know, but he's made his presence felt in a big way this year. Marte has undergone an unexpected power surge, and has already achieved a career high in homers with 20. He sports a wOBA of .397, an xwOBA of .369, xSLG of .523, and 3.7 offensive WAR according to Fangraphs, first among all 2nd basemen. Moustakas has some name recognition from his time with at third base with the championship Royals of 2015 which may give him an edge over Marte. But will it work? Well, his 22 homers compare favorably to Marte. But more importantly, he has established new career highs in xwOBA (.376) and xSLG (.527), at least for now. They just barely edge out Marte. However, his 2.7 WAR falls a full one win short of Marte's mark. (If you desire another source for WAR because of how it is, Marte still wins 3.7 to 3 on Baseball Reference.) Verdict: Similiarly to the Cron/Santana situation earlier, you could go either way with Marte or Moustakas. I'll give Marte the win here, though, because he adds more value to his team than does Moustakas, with extremely similar Statcast numbers and production. Winner: Ketel Marte AL 3B: Alex Bregman (HOU) vs. Hunter Dozier (KC) vs. Gio Urshela (NYY)
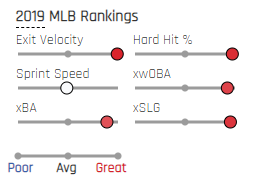
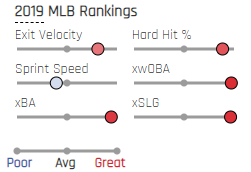
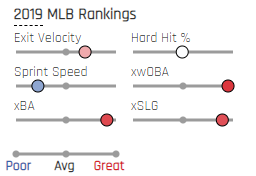
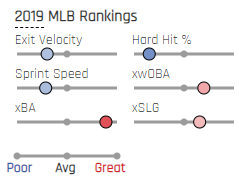
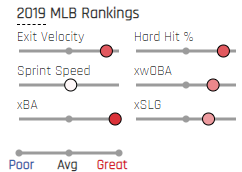
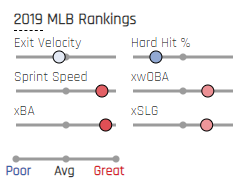
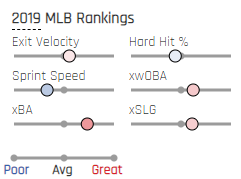
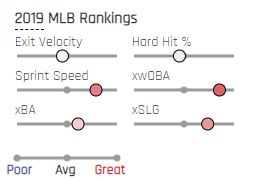
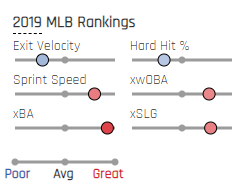
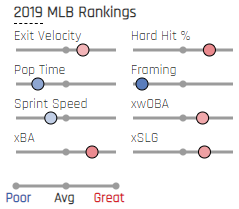
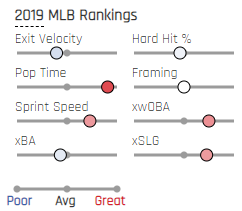
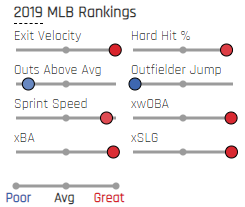
Alex Bregman is having another great year at the hot corner for the Astros, with a .371 xwOBA to go along with his 22 homers and 52 RBI. He's slugging .539, but xSLG projects a much lower .443. His quality of contact is decidedly poorer than that of Dozier and Urshela, but good counting stats and name recognition will likely carry him here. Onward to Hunter Dozier, the first man I covered on this blog. Two months after that initial post, Dozier has slowed his home run pace (hard to hit 'em at Kaufman) but his quality of contact as well as on-base ability has remained excellent. Sporting a .407 wOBA, .382 xwOBA, and .520 xSLG that exceed his two competitors, he has a fantastic case for the All-Star Game that is overshadowed somewhat by his relative obscurity. Playing in one of the smallest markets in the country in your breakout season tends to have that effect. Then, finally, Urshela. Rafael Devers of the Red Sox should've been a finalist over him, but oh well. I will dwell on Urshela less than the others. His stats (.812 OPS, .304 xBA, .356 xwOBA, .468 xSLG) are all well and good, but Urshela doesn't even play every day for the Yankees right now. Why should a guy who's on the bench more often than not make the All-Star game over Dozier or Bregman? Verdict: With Urshela disqualified due to being a friggin' backup, we're left with Bregman and Dozier. Bregman has the counting stats in his favor, but Dozier's excellent expected stats and peripherals as well as higher quality of contact earn him the edge in this fight. Fat chance you'll actually see him start over Bregman, though, considering what the fan vote is. Winner: Hunter Dozier NL 3B: Nolan Arenado (COL) vs. Kris Bryant (CHC) vs. Josh Donaldson (ATL)
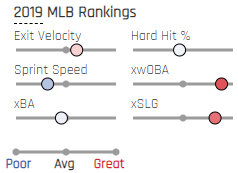
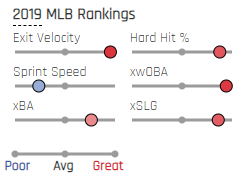
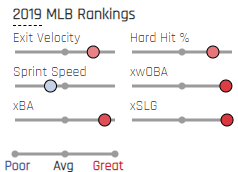
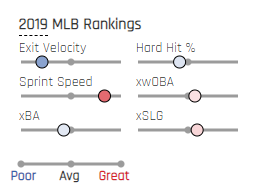
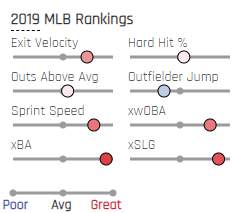
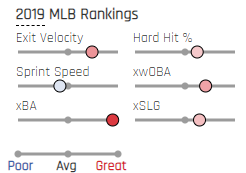
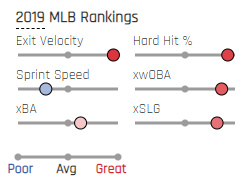
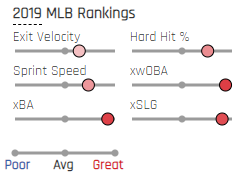
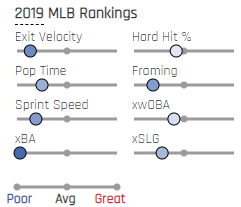
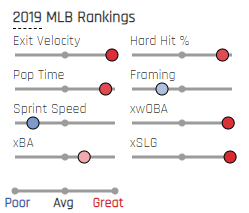
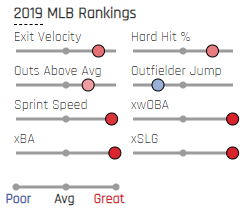
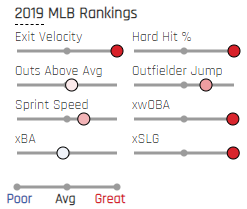
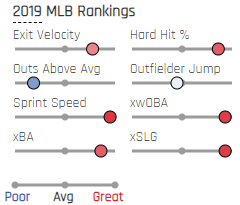
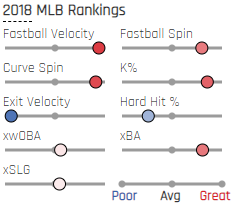
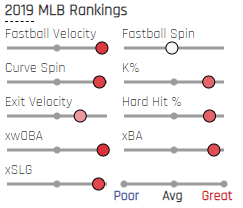
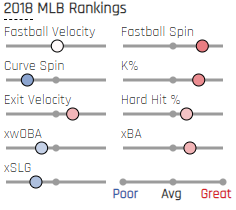
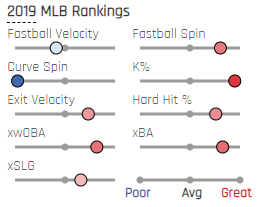
Angry doesn't begin to describe it. I'm furious. Incensed. Intensely disgruntled. How did Anthony Rendon not make the cut? Were Nationals fans too demoralized by the state of their franchise to vote for him? Nah, I doubt that -- it's probably Braves fans' fault. Ha. Anyway. Even though Rendon has been better than all three of these third baseman this year, and should receive MVP consideration, this is the lot we're stuck with. First: Arenado. No, that image is not incorrect. He's just hitting like a slightly above average player this year. Before you shout "COORS" to all of Arenado's offensive accomplishments, know that this is somewhat of a down year when it comes to his peripherals. Not on the big scoreboard at Coors Field, mind you, but in Nerdland here. A .355 xwOBA and .462 xSLG are just not the elite level we've come to expect from Arenado over the years. But he still has a .953 OPS which will keep him relevant in the discussion. Next up is Kris Bryant. Finally healthy again after a rocky 2018, Bryant is helping to lead the charge for the Cubs offense with a .934 OPS, .394 wOBA, and .376 xwOBA. And he's doing it without hitting the tar out of the ball. On the other hand, Josh Donaldson of the Braves is massacring the ball with elite exit velo and hard rate, and has compiled a .364 wOBA, .377 xwOBA, and .508 xSLG. Seems like that calf is healthy again. Verdict: Donaldson gets my vote due to his superior peripherals and insane hard hit stats. Ironic. The man that seems to have stolen his spot from Rendon turns out to be the most deserving, and Arenado seems to be the odd one out. Winner: Josh Donaldson Though, just to underscore my disgust, here. Have Anthony Rendon's MLB rankings according to Statcast. Feel free to compare it to the three "finalists." 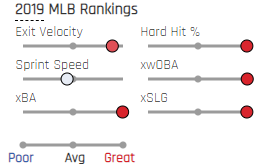 #RendonWasRobbed...as always. We'll have to hope the Final Vote saves him. Sigh. Most underrated player in the sport! When will you sheeple wake up! He's elite! ELIIIIIITE! AL SS: Carlos Correa (HOU) vs. Jorge Polanco (MIN) vs. Gleyber Torres (NYY)
I get it. Francisco Lindor wasn't on here because he missed a lot of time with injury. But he's actually put together more plate appearances (276) than Correa (214). Correa's numbers are very, very good (.394 wOBA, .406 xwOBA, .561 xSLG, but he hasn't played nearly as much as Polanco (344 PA) and Torres (309). Polanco has been a breakout player for the Twins and an integral part of their slugging revolution. Despite not being a very hard hitter, he collects extra base hits in high volume, with a .532 SLG and .500 xSLG. His xwOBA of .366 is also quite respectable. Torres got here by the voting power of the New York market. His peripherals are...fine, but nothing to write home about. He's been about average offensively, not particularly excelling in anything. His xwOBA of .345 and xSLG of .480 are both above average, but they fall short of Polanco and Correa. Verdict: Correa is actually a perfectly fair vote to make, as when he's healthy, he is absolutely All-Star caliber. But my vote goes to Polanco, who has gotten more time to make his case. His numbers have been fantastic, and he's putting in work for a very impressive Twins' offense. Winner: Jorge Polanco NL SS: Javier Baez (CHC) vs. Trevor Story (COL) vs. Dansby Swanson (ATL)
Paul DeJong deserved a shot, but ah well. Let's look at who we have. There sure is a lot of red here. Javier Baez was the NL MVP runner-up last year, and this year, he has maintained that level of play. Baez has a .357 xwOBA and .529 xSLG, as well as 2.9 WAR, which is tied with Trevor Story. Story has the batted ball skills and surprisingly elite speed, but his expected stats fall a bit short of the mark. A .340 xwOBA and .456 xSLG fall short of his competition. Now, Swanson. How'd he get here? Same reason as Donaldson. But he does have a lot of reason to be here, surprisingly. He has an xwOBA of .367 and xSLG of .508 which compare similarly to Baez. However, his real life numbers fall quite short of the Cubs' star. His .786 OPS is nearly 100 points less than Baez' .874. Verdict: Yeah, Swanson's a nice dark horse candidate for Statcast, but Baez has just about matched his peripherals while putting together more real world production, which certainly counts. Winner: Javier Baez AL C: Robinson Chirinos (HOU) vs. James McCann (CHW) vs. Gary Sanchez (NYY)
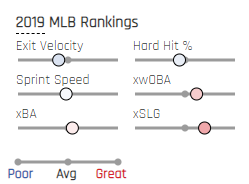
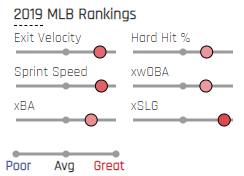
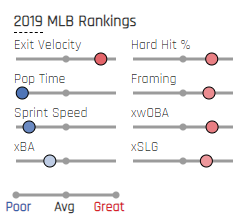
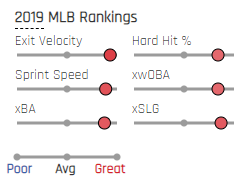
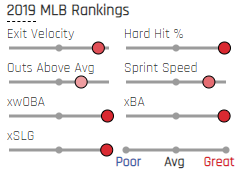
Catchers have made a comeback offensively this year after the doldrums of last year where there were maaaaaybe two good offensive catchers? Robinson Chirinos has certainly performed well with an .837 OPS, but if you look at his Statcast rankings...he's blue in everything. I don't think I need to go too much further in depth to underscore the fact that he is outclassed. Omar Narvaez should've been in his place. Next we have Chicago's James McCann who has undergone a career revival since taking his talents to the South Side. His hard hit rate, average exit velo, xwOBA (.356), and xSLG (.484) are all easily career highs. He makes a compelling case. But in the end, he cannot match the slugging prowess of Gary Sanchez. Scorching exit velo and hard hit aside, he also has an xwOBA of .410 and an xSLG of .641, which both rank within the top 15 in all of baseball. Put that together with his 23 homers to this point and OPS of .939, and it's a no-brainer. Verdict: Gary is good. This is likely the easiest decision I'll have to make. Winner: Gary Sanchez NL C: Willson Contreras (CHC) vs. Yasmani Grandal (MIL) vs. Brian McCann (ATL)
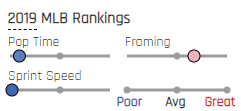
Oy vey, enough with Chicago and Atlanta ruling the world! The only position where one of these two teams doesn't have a rep in the final vote is at second base (the Cubs' rep was Daniel Descalso, and even Cubs fans have to admit he's not an All-Star.) But in all fairness to the Cubs faithful, Contreras deserves to be here. His .986 OPS is the highest among all qualified catchers in the league. Despite not destroying the ball like Sanchez, his xwOBA of .363 and xSLG of .488 bear out his performance. They're not elite, but Contreras' performance to this point absolutely has. Grandal of the Brewers is more like Sanchez in his hard-hitting ways. He's mustered a .926 OPS so far this season. It turns out that Grandal has played a bit more, with nearly 50 more plate appearances than Contreras (301 to 266). In addition, his xwOBA (.369) and xSLG (.489) are both in the same neighborhood as Contreras. Then, finally, Brian McCa--huh? What's with his graphic? Well, Brian McCann only has 164 plate appearances. He hasn't really played enough to even have most of his graphics up. His .344 xwOBA falls short of the other two, anyway. Verdict: This is insanely tough. My heart is telling me Grandal, but my brain tells me Contreras. I think I'll have to play the real-world results card. Contreras' higher OPS gives him an edge, and I don't think 50 or so plate appearances isn't enough of a gap to put Grandal higher. Winner: Willson Contreras DH: Nelson Cruz (MIN) vs. J.D. Martinez (BOS) vs. Hunter Pence (TEX)
This is a tough one. My home run loving self would love all three to join in the All-Star festivities, but we must be pragmatic. I'll be quick and easy with this one. J.D. Martinez has over 100 more plate appearances than Pence, and 94 more than Cruz. His .416 xwOBA and .603 xSLG exceed Cruz' .396 xwOBA and .563 xSLG, as well as Pence's .373 xwOBA and .521 xSLG. Martinez is the standout here, even if his home run total is down. Verdict: It's gotta be J.D. Though Nelson Cruz is still awesome at 38, and Pence's career revival deserves a post all its own. Winner: J.D. Martinez Here comes the hard part. AL OF: Mike Trout (LAA), Joey Gallo (TEX), and George Springer (HOU)Full list of candidates: Mookie Betts (BOS), Michael Brantley (HOU), Joey Gallo (TEX), Aaron Judge (NYY), Austin Meadows (TB), Josh Reddick (HOU), Eddie Rosario (MIN), George Springer (HOU), Mike Trout (LAA). I'll explain why the three players in the title made the cut.
It is impossible to accurately create an All-Star Team without including the best player in the world. Mike Trout belongs here. His .476 xwOBA and .668 xSLG are the best in the AL. In the real world, he also has a 1.090 OPS, 1st in the AL. Joey Gallo's power is terrifying. He has more career homers than singles. He's known for that. But this year, he took his skills to the extreme. Only Aaron Judge (who I disqualified due to not having played enough) has a higher average exit velocity and hard-hit rate. Gallo also has a 1.064 OPS (2nd in the AL) and a .437 xwOBA, which ranks 4th among all batters. His xSLG of .650 is the second highest in the AL, behind Trout. George Springer is in the midst of a career year, and no injury can stop him. His xwOBA of .434 is fifth in the Majors. His xSLG of .630 is 7th. He has an OPS of 1.046 (3rd in the AL). He hasn't been quite as good as Trout or Gallo, but he's been ahead of the rest of the pack, which is what matters here in the outfield. NL OF: Cody Bellinger (LAD), Christian Yelich (MIL) and Ronald Acuña Jr. (ATL)Full list of candidates: Ronald Acuña Jr. (ATL), Albert Almora Jr. (CHC), Cody Bellinger (LAD), Charlie Blackmon (COL), Jason Heyward (CHC), Nick Markakis (ATL), Joc Pederson (LAD), Kyle Schwarber (CHC), Christian Yelich (MIL). I'll explain why the three players in the title made the cut.
This crop of players is honestly a joke. Three Cubs, all of whom don't deserve to be here. Two Braves. And then two Dodgers, a Brewer, and a Rockie. There are just 5 teams representing the entire outfield. This is the problem with the fan vote. But enough preaching. I'm quite satisfied that these three will be the three going into the Game; otherwise, there's a huge problem. The NL MVP is Cody Bellinger's to lose. He's been elite at everything this year, as the chart shows. He's first in the Majors in OPS (1.163), xwOBA (.482), xSLG (.702). His defense is also elite. He has been the best player in baseball this year. The reigning NL MVP is Christian Yelich. He's been absolutely outstanding in his own right but is barely overshadowed by Bellinger. His OPS is 1.149--barely behind. His xwOBA of .433 is 3rd in the NL behind Bellinger and Anthony Rendon. His xSLG of .642 is also third behind Bellinger and Rendon. (See why I'm mad that Rendon got snubbed?) Still elite, but perhaps an ocean behind these two is Ronald Acuña Jr., following up his Rookie of the Year campaign with a spectacular sophomore season. It was between him and Charlie Blackmon for this final spot, but Acuña's Statcast peripherals were far more impressive than Blackmon's. His .871 OPS is fine enough, but his .391 xwOBA truly shines, as does his .548 xSLG. Blackmon (.999 OPS but .359 xwOBA and .510 xSLG can't quite compare.) I believe Acuña deserves your vote. Conclusion and Final RosterThis vote was honestly a mess (friggin' Braves and Cubs), but we can still pick out a very good, deserving pair of starting lineups here. In the end, here's what we came up with:
Not too shabby. Thanks for reading, and don't forget to vote! Polls close at 4 PM.
Welcome to the second edition of Persons of Interest! This iteration will discuss five starting pitchers who have hit the ground running to begin 2019. There's no divisional limitation this time; any starter is fair game. So who have I found that pops out at me? Feel free to peruse the contents of this post to find out. Before we begin: if you're unfamiliar with advanced baseball stats and need to know what they mean, I recently made a post that explains all the terms you need to know to enjoy this blog thoroughly. Click here to view it. #1: Luis Castillo - Cincinnati Reds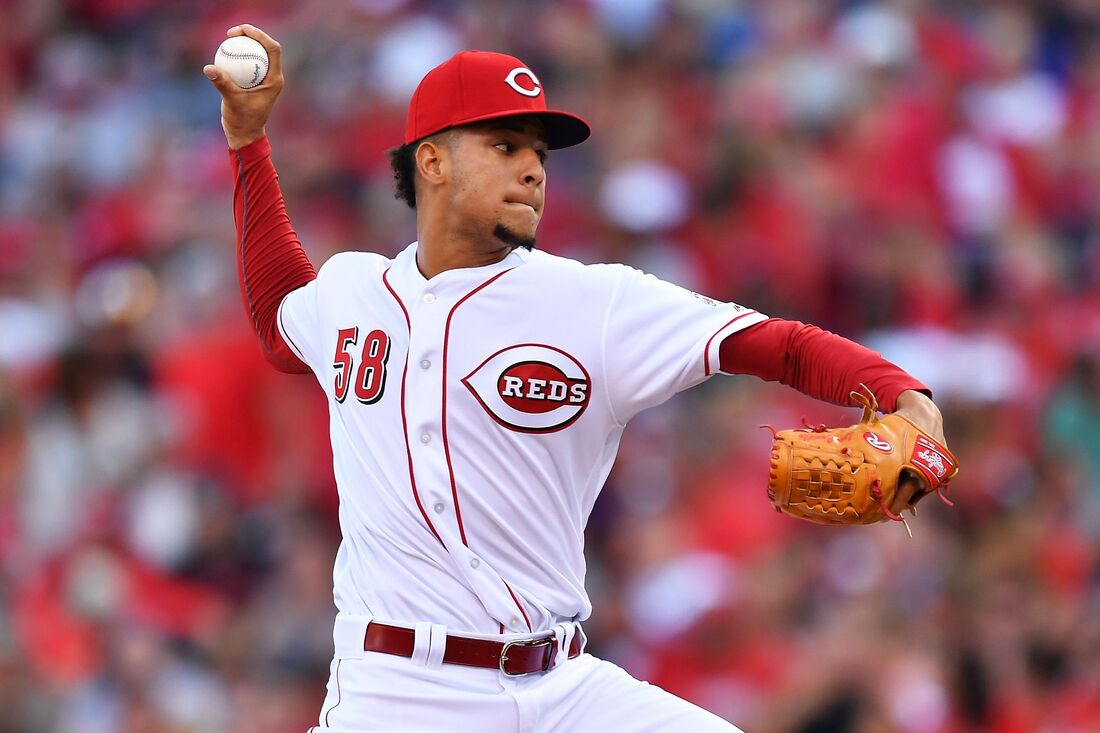 It's about time. Luis Castillo (not the old Mets infielder, this Luis Castillo) has been on breakout lists for a few years, but he was never quite able to get it together. Until this year. Castillo has been absolutely electric, the ace of a very surprising Reds pitching staff. In his first 10 starts of the year, Castillo has a 1.90 ERA (4th among qualified starters) in 61.2 innings. His FIP is 2.62 (5th in baseball), and his xFIP of 2.96 is in the same neighborhood. His 76 strikeouts rank 6th, and his 31.8% K rate is 8th. His wOBA and xwOBA are identical: a scorching-hot .231, first place among all pitchers (minimum 100 batters faced). When you look up the starting pitching leaderboards right now, you will find Castillo close to the top. What caused this rise into not just relevance, but dominance? Well, for starters, that K rate that ranks in the top 10 in the league this year is an 8.5% increase from his mark last year. A big reason for this is his increased reliance on his changeup, which was always his go-to strikeout pitch. But now he uses it nearly as often as his four-seamer; and it has become one of the most reliable putaway pitches in the game. 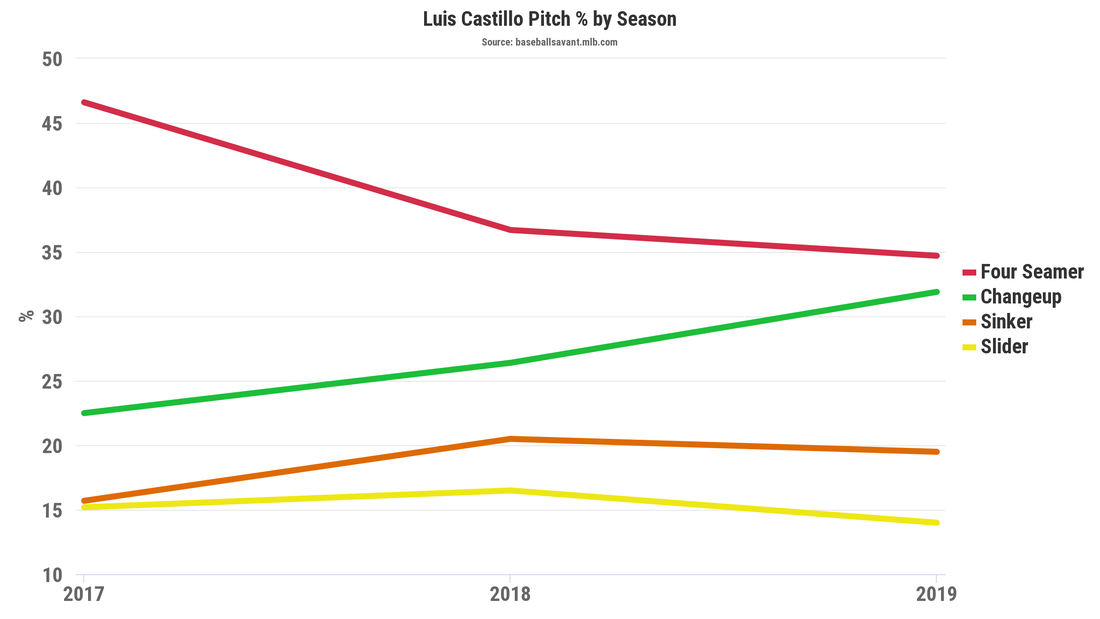 Note the green line; over the years Castillo has come to rely on his changeup as much as his four-seamer--which averages 96 mph, by the way. With this trusty changeup, he has collected 58 strikeouts. He gets whiffs with it 54.4% of the time. Over half the time a player swings at Luis Castillo's change, they miss. Even when contact is made, hitters are averaging a pathetic 80.6 mph exit velocity and -1 degree launch angle against it. It's simply one of the best individual pitches in any pitcher's arsenal right now in baseball. Along with a new lethal weapon, he has also all but eliminated his home run problem. Last year, Castillo surrendered 28 home runs, and when he allowed a fly ball, there was a 17.9% chance it was going all the way over the wall. Among 57 qualified starting pitchers listed by Fangraphs, that rate was the 2nd highest in baseball. (The highest? Jon Gray of the Rockies, who pitched in Coors Field half the time.) This year, he's dropped that right down to 9.4%. Among 86 qualified starters listed by Fangraphs, that rate ranks 19th. He's only allowed 3 dingers all year. There's a good reason why that is, too. When he forces contact, it's soft, yes, but it's also mostly on the ground. He has a 63% ground ball rate, which is a whole 15.1% higher than in 2018. It's really really hard to square up a ball against Castillo. First you have to be lucky enough to even hit the ball, but then you have to get enough of it to drive it hard and in the air. Not a lot of people have been able to do it. The one thing Castillo needs to do is cut back on his 10.5% walk rate, and if he manages to limit his free passes, he could very well be a Cy Young candidate. ...Though I imagine as a pitcher on a small market noncompetitive team, he'd probably have to have a 1.90 ERA over the entire season to get it.
#2: Chris Paddack - San Diego Padres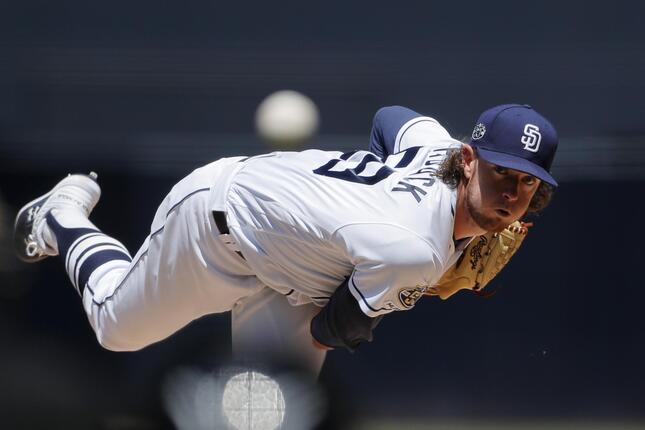 Chris Paddack doesn't give a damn what you think of him. The Texan right-hander showed up to his first career big league start in a big ol' cowboy hat. Why not? You got a problem with that? He just randomly started up a beef with Pete Alonso that the Mets slugger had no intention of reciprocating, just because Alonso was the early NL Rookie of the Year favorite, and he wasn't. (Oh, and he struck him out swinging twice.) He doesn't give a damn what Pete Alonso thinks of him. And he sure as hell doesn't give a damn what you think of him. That's why it's hard not to respect the hell out of this rookie. 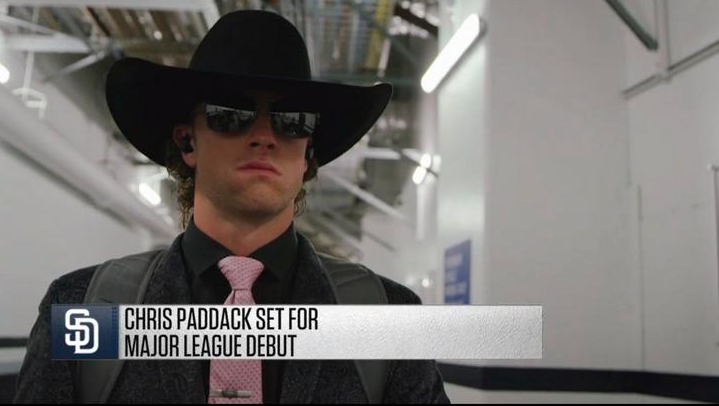 Something something horses in the back... Of course, it's easier to respect a pitcher if he's good, and Paddack has been good and then some. A rookie who made an Opening Day roster spot (a rarity in today's game), he quickly paid off in dividends for the Padres and has yet to slow down. In his first 9 Major League starts, he has an ERA of 1.93, a FIP of 2.74, and 56 strikeouts in 51.1 IP. He has allowed a wOBA of .212 to opposing hitters (his xwOBA is a slightly less dominant, but still very dominant .251), while mitigating hard contact (average exit velocity is 85.5 mph, in the bottom 10% of the league) and walks (5.6%). He shuts hitters down. And he does it with the swagger of a young Clint Eastwood. 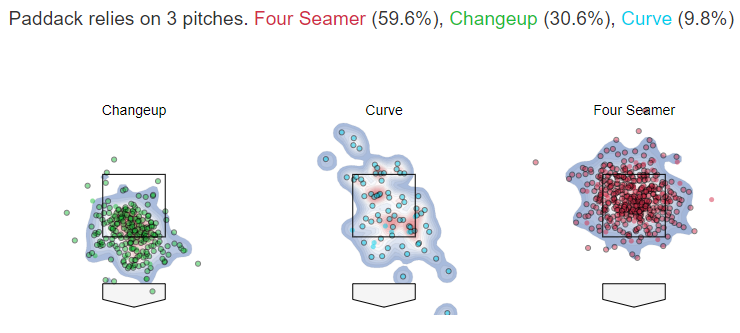 Paddack needs just 3 pitches to do all his work. He uses a 60/30/10 combination of four-seamer/changeup/curveball. He's a bit old school in that sense. He's also old school in the sense of his four seamer not being stratospheric in velocity, but it gets the job done. Opposing batters are hitting just .158 off his four-seamer, with a .265 xwOBA. His changeup is an effective putaway pitch that strikes out opponents a third of the time. His slow, low-spin curveball isn't as good at mitigating hard contact but it's a good third pitch for mixing it up. All in all, it's a pretty standard arsenal, and he can get people out with all of them. Now, there's one thing you need to know about Chris Paddack's outings. They're short but sweet, and it's by design. In 2016, when he was 20, he had to undergo Tommy John surgery because of a UCL tear. Three years later, the Friars are still being cautious, keeping his outings capped and working him on a longer schedule, according to The Athletic. 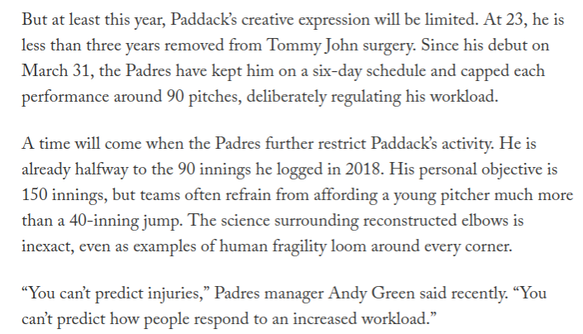 An excerpt from "Scott Boras is ‘having conversations’ with the Padres as client Chris Paddack’s innings limit looms on the horizon" by Dennis Lin of The Athletic. Seems it's standard procedure. So if you're wondering why he only has around 50 innings in 9 starts, that'll answer your question. It's probably a good idea. One last thing: Chris Paddack isn't even the top pitching prospect in the Padres' system. Lefty hurler MacKenzie Gore is the #2 prospect in the Padres' organization (Paddack is #5), and the #8 prospect in all of baseball. He's expected to make his MLB debut some time next year. These new-look Padres are gonna be scary, and if Paddack's any indication, it'll be the pitching leading the charge. 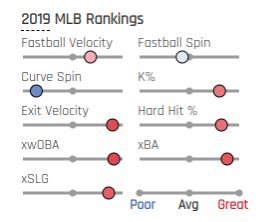 Not bad for a guy who skipped AAA entirely, wouldn't you say? #3: Tyler Glasnow - Tampa Bay Rays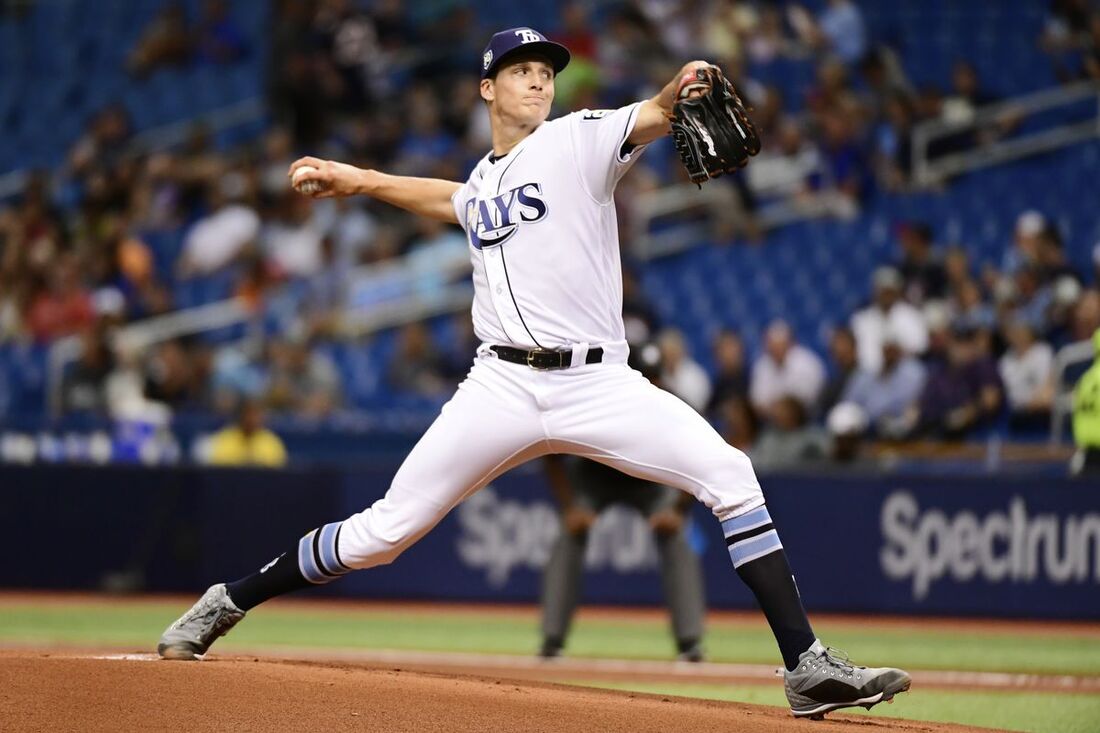 Well, this is a bit awkward. Recently, Tyler Glasnow hit the IL with a right forearm strain and will miss the next five weeks or so. This is a tough blow to the Rays, who will have to use the opener with more frequency to compensate. But what a pitcher Glasnow has become! Pirates fans will be hearing about the Chris Archer for Austin Meadows and Tyler Glasnow trade for years to come, and with good reason. Meadows is hitting .337/.422/.673 and Glasnow has an ERA of 1.86 through his first 8 starts. Now, obviously, I'm gonna be focusing on the best pitcher in that trade (sorry, Chris) and talk about what he's done to soar so high this year. But also, I'll be talking about why he never really worked out in Pittsburgh, a very pitcher-friendly environment. I'll go in chronological order, starting with Glasnow's troubled times as a scallywag in the Steel City. He got his first cup of coffee in the Majors in 2016, pitching in 7 games (4 starts) compiling a 4.24 ERA in 23.1 innings pitched. His stats were very plain-Jane. Nothing was particularly above or below average. The next year, he lost his way. In 15 games (13 starts) he clunked out a 7.69 ERA in 62 innings. His 14.4% walk rate and .379 xwOBA against were both under 5th-percentile marks in the entire league. He was moved to the bullpen and managed to carve out a roster spot there the following year. He put up a 4.34 ERA in 34 games, all out of the bullpen, in Pittsburgh, before The Trade on July 31st sent him to Tampa. So, not great. Glasnow always had trouble with walks while in Pittsburgh, never having a walk rate below 10% while there. Advanced stats like xwOBA started to like him a bit more near the end, but his standard stats were still unremarkable. We won't find our answers there. Let's look at his pitch arsenal. 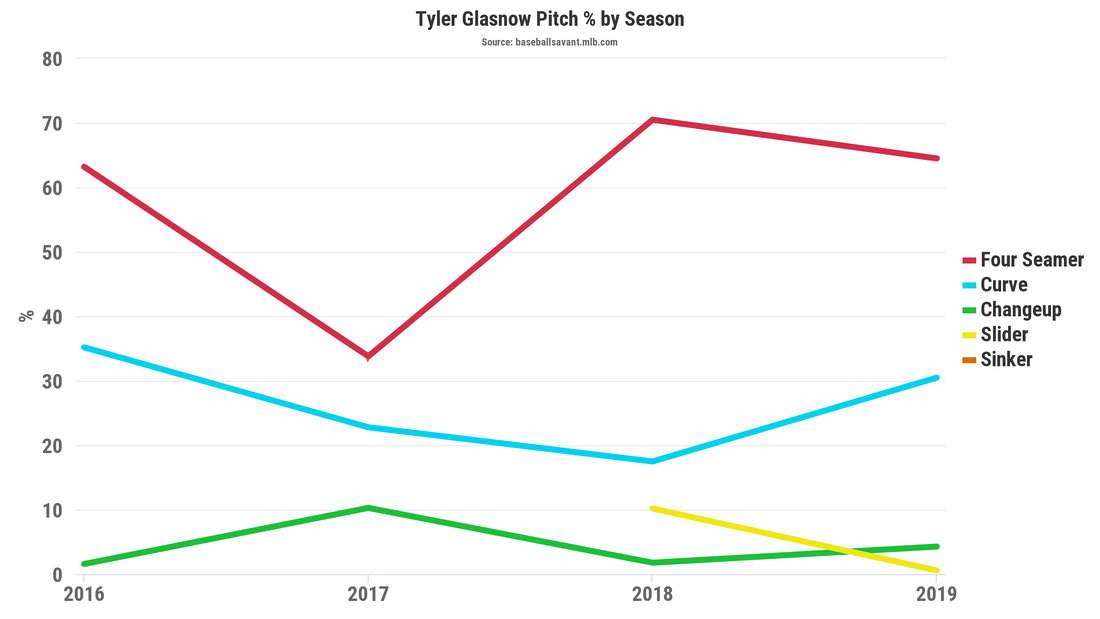 It's tough to tell, but at the bottom of the red line in 2017, there's a small orange marking that shows sinker use. It's almost entirely obscured by the red line because Glasnow's 4-seamer rate and sinker rate were within a percent of each other. He also never threw this sinker before or after 2017, which is why it's a mere dot and not a line. The Pirates pitching staff, led by coach Ray Searage, never seemed to have a good idea of what Glasnow should throw to be effective. In 2017, they seemed to instruct Glasnow to lay off the four-seamer and instead utilize a four-seamer-sinker combination. As we saw, his ERA skyrocketed, so they quickly realized that the sinker wasn't gonna work. So next year they completely reversed course and prescribed a ton of 4-seam fastballs with no sinker. It seemed to be a step in the right direction, but the results weren't quite coming. This season with Tampa he's lowered his fastball rate marginally and allowed his curveball to shine through a bit more. And it's worked. After being traded to Tampa, Glasnow was immediately granted a spot on a rotation that just about existed in theory only. He posted similar standard stats with the Rays, but he was already starting to cut back on walks. Something was percolating. This year, he's unleashed the heat. The walks, once a main issue for Glasnow, are now down to just a 4.9% rate. Similarly to Castillo, he had a home run problem (18.3 HR/fly ball rate in 2018) and vanquished it (8.3 HR/FB% in 2019). The curve, upon which Glasnow has put more emphasis, strikes out the hitter 54.5% of the time a plate appearance is completed with it. After all is said and done, he has a 2.18 FIP (best in the league!), a .229 wOBA and .232 xwOBA (which is 2nd in the league right behind Luis Castillo, same minimum sample size). It seems he's finally found his identity as a primarily fastball-curve guy. For a man that nobody in Pittsburgh seemed to be able to figure out, it's a pretty satisfactory conclusion.
Speaks for itself. What a transformation. #4: Caleb Smith - Miami Marlins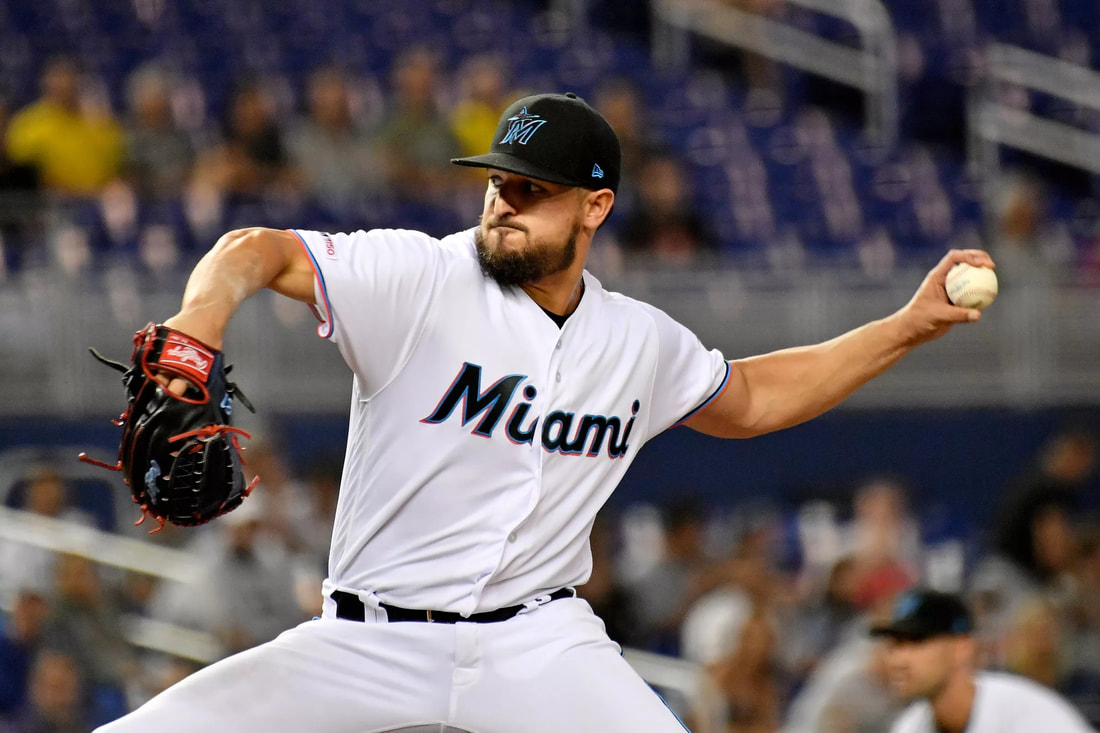 Do you want to know a really crushing fact? Marlins fans, look away, for now. ...Are you looking away? OK, here it is. Luis Castillo and Chris Paddack were both once Marlins prospects. Paddack was traded for Fernando Rodney, who had a 0.31 ERA in San Diego before coming to Miami and being totally awful (25 runs allowed in 36.2 innings). Castillo was traded in a deal for...Dan Straily. Now, granted, Castillo's trade history is FAR more complicated. He was traded from the Giants to the Marlins for Casey McGehee in 2014, then in 2016 went to San Diego in a trade that sent Andrew Cashner, Tayron Guerrero, and Colin Rea the other way to Miami. Then two days after that, the Marlins got Castillo back by sending Rea back to the Padres. ...And then came the Straily trade with the Reds in January 2017. Yep, the Marlins passed on Castillo twice! ...Point is, the Marlins could have had 3 of the 5 pitchers on this list. But enough dwelling in the past. At least they got one right. The Marlins do have Caleb Smith. The 27-year old southpaw was part of an innocuous swapping of spare parts between the Yankees and Marlins and was totally average (4.19 ERA, 3.92 FIP, 4.42 xFIP, .320 xwOBA) in 16 starts for a garbage team before going down in June and missing the rest of the season with a left shoulder injury. Now healthy and pitching for an even MORE garbage team, he's fashioned himself into a very intriguing under the radar ace. He boasts a 2.38 ERA (as well as a 2.91 FIP and 2.93 xFIP) through his first 9 starts (53 innings pitched.) 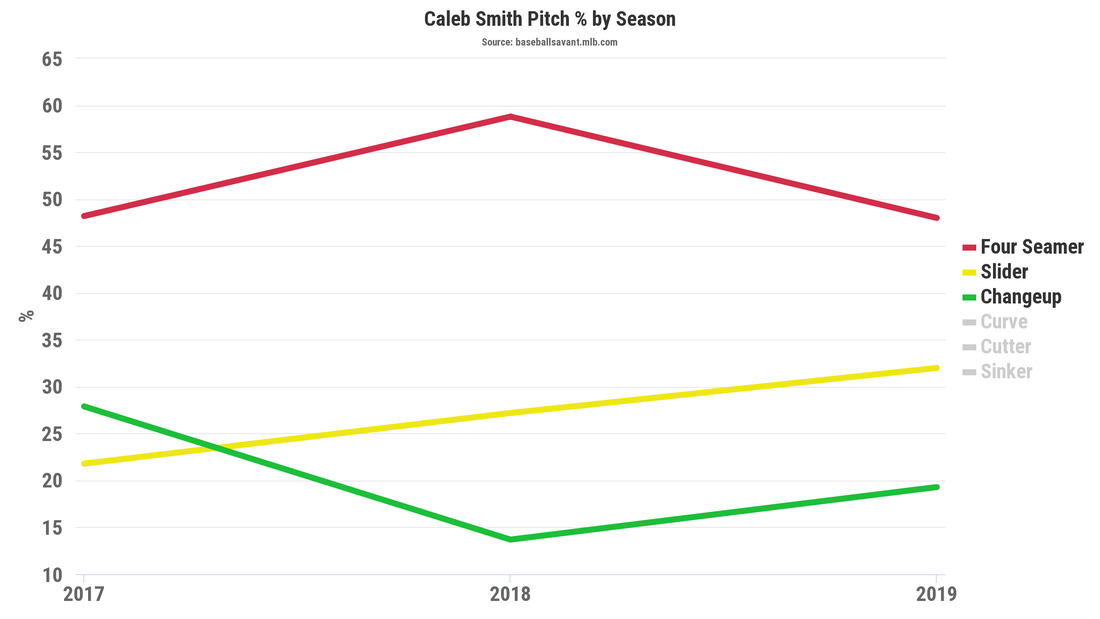 Why are the curve, cutter, and sinker grayed out? Because he uses them all less than 1% of the time each. It's much less clutter to just not include them. You'll forgive me, won't you? He's doing it with a 35.5% K rate (which ranks in the top 5% of the league). He employs a 50/30/20 fastball/slider/change combination and all three pitches have plus strikeout ability. He's also decreased his walk rate (10.1% to 7.0%) and hard hit rate (33.7% to 32.2%). His xwOBA has shot down from .320 to .271. The hope for Caleb Smith is to stay healthy for a full season and keep missing bats with his three main pitches, and who knows? He could be headlining a competitive Marlins team's pitching staff in the future. Though Marlins fans may wish that Luis Castillo or Chris Paddack came along for the ride.
#5: Mike Soroka - Atlanta Braves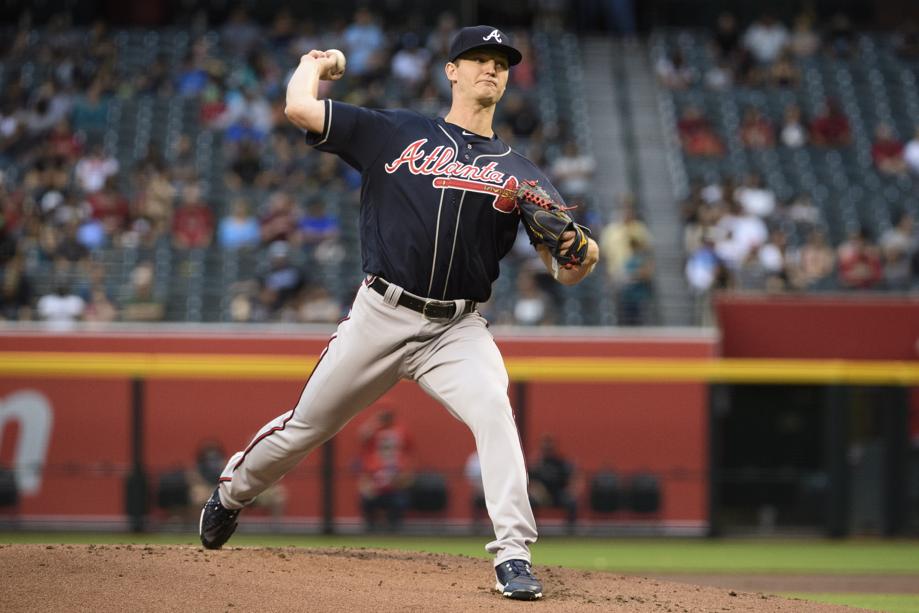 The Braves NEED Mike Soroka. He's not just helpful to a playoff run. He is essential to one. When he's not fending off hockey-related questions from schmucks like John Smoltz (why didn't you play that sport like other Canadian kids?"), the Calgary native is busy blowing hitters away as the face of a youth movement on the mound for the Bravos. He got his first taste of action in The Show last year, but was plagued by a right shoulder issue and missed the rest of the season after going on the IL in June. He didn't make the team out of camp, but was called up on April 18th as the Braves explored their options while Mike Foltynewicz was hurt. And he stuck. Soroka is through 7 sparkling starts this year and currently boasts an ERA of 1.01 in 44.2 innings pitched. His wOBA (.217) and xwOBA (.272) against are both excellent and indicative of Soroka performing at an elite level. He's another soft-contact guy: just an average exit velocity against of 84.5 mph (bottom 6% speed in the league). And he's gone about it in an interesting way. 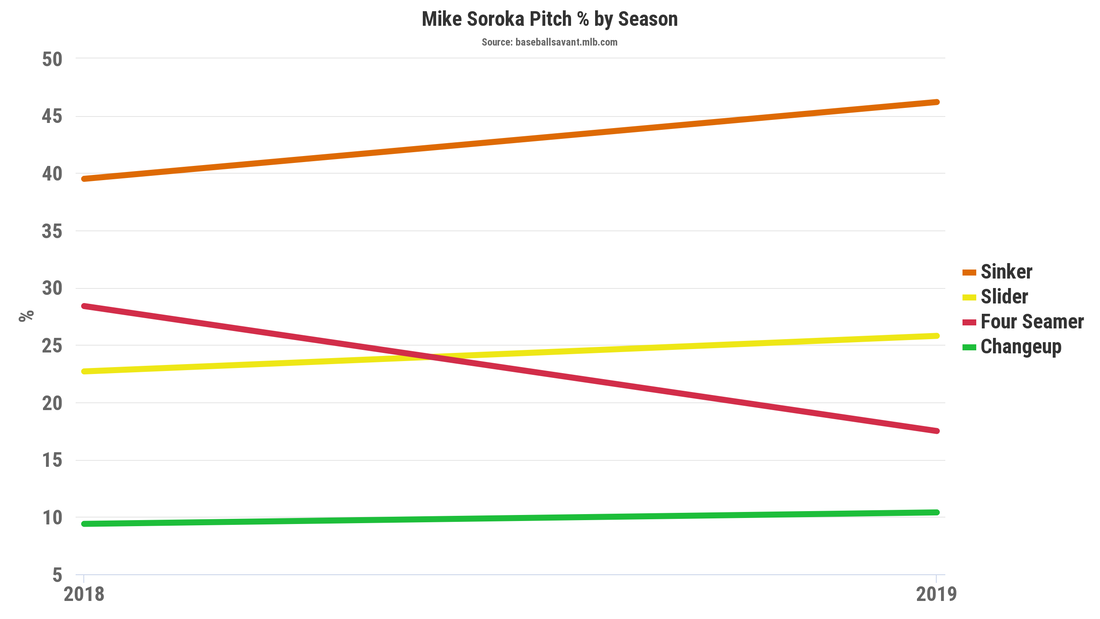 While the other four pitchers on this list rely primarily upon a traditional four-seam fastball, Soroka has actually cut back on his four-seamer and works mostly with a sinker. This pitch initiates a lot of soft contact on the ground (84.3 mph average exit velo, -3 degree average launch angle), which is golden for mitigating offense. Indeed, batters are hitting just .153 and slugging .222 against the sinker. He's also bumped up his slider use this year, a sign that he's more confident with it. This pitch is what gets most of his strikeouts, with a K rate of 45%. Soroka's four-seamer isn't particularly fast, and it gets hit harder than his other pitches (hence it being used less), but he still gets decent results with it. And finally, his changeup is a nice weapon to have to throw people off. Players who swing at the change miss 48.6% of the time. All in all, you've got an unpredictable pitcher who doesn't overuse any of his weapons and will keep you guessing. Honestly, that's my kind of pitcher. I dig Mike Soroka. Obviously, he won't continue to have a 1 ERA for much longer, but the potential is limitless with this guy, and as a team that relies heavily on their starters to hold it down, the Braves should be thrilled with who they have here. Just keep an eye on that right shoulder. 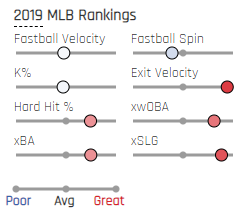 Thanks for reading Persons of Interest! If you like the blog, be sure to give it a follow on @blockislandball on Twitter! That way you'll be notified of future posts like this one! The blog also has an email address if you wish to contact me about it for whatever reason: [email protected]. Until next time!
 Get it? SABERmetrics? ...Please? Can I at least get a golf clap or a pity laugh? I decided that I'd make a post as a key of sorts for all of the different stats I'll be making use of in Persons of Interest and other miscellaneous nerdposts. It's a neat guide with everything in one place. This will save me the time of explaining things in later posts. Batting StatsLaunch angle: the degree angle at which the ball leaves the bat after contact is made. The higher the launch angle, the higher in the air the ball is getting struck. Exit velocity: the speed at which the ball leaves the bat after contact is made. Harder contact is better contact. Hard hit rate: the rate of batted balls a player has hit that exceed a 95 mph exit velocity. Elite hitters in this regard like Aaron Judge and J.D. Martinez will likely have a hard hit rate around 50% by the end of a full season. The average hitter's hard hit rate in 2018 was about 37%. Barrel: the ideal combination of launch angle and exit velocity. Barreled hits are the most valuable hits you can have, because they are highly likely to not only be hits, but extra base hits. wOBA: weighted on base average. This stat is like OBP, but it does not create all methods of reaching base equal. It's intuitive; home runs are more valuable than mere singles. In a way it's an eldritch hybrid of slugging and on base. It works well for determining who is contributing the most overall offensively. This stat actually works for pitchers as well, but for them, a pitcher's wOBA is what opposing hitters' wOBA is AGAINST them. xwOBA: expected weighted on base average. This is wOBA with one extra step to it. It's what a hitter's wOBA is expected to be when taking exit velocity, launch angle and other quality of contact information into account. For example, on May 16th, in a game between the Cardinals and Braves, Dexter Fowler hit a fly ball off Touki Toussaint at 101.5 mph and a 24 degree exit velocity. It was a barrel. Balls hit like that have an expected batting average of .730. But then Ronald Acuña caught it in center field for a loud out. Despite this fact, xwOBA gives Fowler credit for the batted ball because of how likely it was to be a hit. This stat works for pitchers too, but it's what opposing hitters' xwOBA is against said pitcher. wRC+: weighted runs created plus. A stat that seeks to give the hitter credit for the value of each plate appearance outcome (similarly to wOBA, they're weighted differently), while also removing the effects of ballpark and hitting environment. The stat is scaled in such a way so that, year after year, the league average is 100. Anything above 100 is above average, and everything below 100 is below average. This makes the stat easy to use. Baseball Reference has a similar stat called OPS+ which works very similarly. Either is acceptable, I just kind of got used to using wRC+. BABIP: batting average on balls in play. A predictive stat. What a hitter's batting average is expected to be if you took away strikeouts, walks, or any other plate appearance result that doesn't involve making contact. This is a good gauge for if a player is hitting into particularly good or bad luck. If a player's BABIP is atmospherically high, you can safely assume that they're getting more than a little bit lucky. An example of low and high BABIPs from last year: Mallex Smith hit .296/.367/.406, but had a .367 BABIP. Hit into some good luck. Carlos Santana hit .229/.352/.414 last year, which is fine, but his .231 BABIP suggests that he was quite unlucky and could've done even better. Fielding StatsDRS: defensive runs saved. A defensive metric that judges a player's defensive ability based on the probability of plays they make or don't make. You'll get bonus points for making plays that are tough, and you'll get points taken away for muffing routine plays. How do they calculate these bonus points? By calculating the probability that a play is made based on batted ball information and the distance needed for a fielder to make a successful play. The leader in DRS last year in any position was Matt Chapman, who took home the Platinum Glove for most outstanding defensive player. He had 29 defensive runs saved. UZR: ultimate zone rating. Same concept as DRS, but with a slightly different nerd formula. DRS is also formatted as an integer, whereas UZR employs a scary decimal point. Angels shortstop Andrelton Simmons' UZR of 19.7 was the highest in the league in 2018. Basically, DRS and UZR are what keep defensive players honest. OAA: outs above average. This stat is currently only available for outfielders, but it's a valuable tool for judging said outfielders' defensive ability, so I'll include it. It works off catch probability, which is rather self explanatory. Well, OAA takes the catch probabilities of all batted balls a fielder attempts to make a play on and quantifies how valuable the outfielder is on the plays they make or don't make. I'll use an example I've used before: this catch from Byron Buxton. (Well, you'll have to watch it on YouTube because MLB is stupid with their copyright, but...) So a batted ball like the one Christin Stewart hit has an xBA of .940: in other words, a 94% hit probability. If Buxton makes the catch, which he does, it adds 0.94 outs to his total. If he doesn't make the catch, he is dinged by a very insignificant 0.06 points. The outs above average stat is rounded to the nearest integer, similarly to DRS. In 2018, the outfielder with the highest outs above average was the Brewers' Lorenzo Cain, with 22. The Braves' Ender Inciarte was second with 21, and Harrison Bader of the Cardinals rounded out the top three with 19. Pitching StatsFIP: fielding independent pitching. What a pitcher's ERA would be when focusing on results that defense does not affect (strikeouts, walks, HBPs, home runs allowed). Similarly to BABIP, it is predictive of future performance. Phillies pitcher Nick Pivetta recorded an ERA of 4.77, but his 3.80 FIP indicated that he was dinged by outcomes that were out of his control. Ergo, his defense was likely somewhat to blame. Indeed, in 2018, the Phillies' defense was far and away the worst in baseball. Check out the rankings of the teams by defensive runs saved in reverse order. 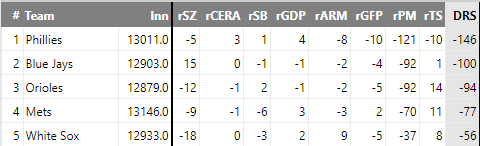 Yeah, not great. With that in mind it seemed like a shoo-in that with an overhauled roster that was more defensively stalwart, Nick Pivetta would break out. Unfortunately, that hasn't happened yet, as he surrendered an ERA of 8.35 in 4 starts before being sent down to the Minors. Analytics aren't flawless, folks. If you're morbidly curious about Pivetta's FIP this year, it's 6.38. Apparently "more defensively stalwart" was a bit of a misconception. xFIP: expected fielding independent pitching. This stat should be put to use more often. I don't think I need to get into the gritty details about this one; you know FIP, you know how expected stats work by now. One thing that you need to know that sets xFIP apart from FIP is that they treat home runs differently. Note the highlighted passage in the following image which explains the stat. 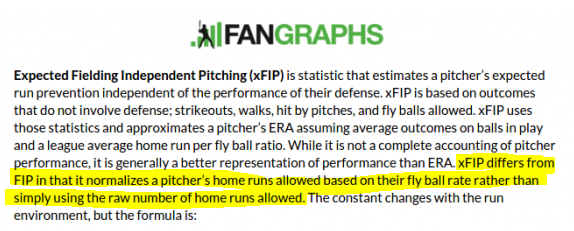 ...Don't worry about the formula. Let's just go back to poor Nick Pivetta. Because, by xFIP's estimation, he got a rawer deal both last year and this year than we anticipated. In 2018, his xFIP was 3.42, which is really damn solid. Then, this year, where he's bottomed out and now sits in Lehigh Valley, probably very bored? He merely had an xFIP of 4.77, HIS ERA FROM 2018. It's not by any means good, but remember: his ERA was upwards of 8. Poor Nick Pivetta. Here's hoping he figures something out in Lehigh Valley. He's already doing rather well there. ERA-: earned run average minus. This is a rather obscure one and it isn't all that intuitive. It's basically supposed to be like wRC+ for pitchers, but instead anything below 100 is above average and anything above 100 is below average. For example, Jacob deGrom had an ERA- last year of 45. Remember, average is 100 and anything below it is good. That's crazy. Now, like I said, it's a bit counterintuitive. If you think of it the same way as ERA and FIP, where a lower number is better, it shouldn't confuse you too much, but I think there are easier ways to quantify pitcher performance that conform more closely to your standard ERA. I might use this on occasion though because it's kinda neat. Just putting this in here to alert you to its existence. FIP-: fielding independent pitching minus. Similar song and dance to ERA-, but with the whole "just worry about what you can control" blanket thrown on it. Pivetta, our FIP champion, had a FIP- of 92, eking out an above average mark there despite an ERA- of 119. Now, again, this stat is pretty neat and I like that it exists, but it won't be my go-to for judging pitcher performance. Maybe if there's a standout in this particular stat I'll include it. And, last but not least...WAR: wins above replacement. How many more games a team would win with this player on the roster. Over a full season...
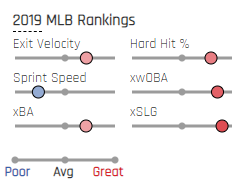
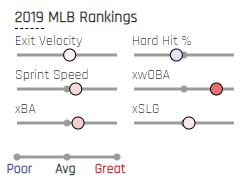
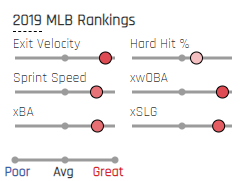
Thanks for reading! Hope this helped!Hey all, and welcome to the inaugural edition of Persons of Interest! What I do here is I take five MLB players that have surprised, impressed, confused, disappointed, or otherwise intrigued me so far in this baseball season. I take a dive into the player’s statistics on Fangraphs and Baseball Savant to investigate the meaning behind their rise or fall. I may also talk about other things related to that player as I see fit. I want it to be a rather loose non-binding format so that it doesn’t feel formulaic and that every installment feels fresh. Without further ado, I present to you Persons of Interest #1: Slam Central! What exactly do I mean by Slam Central? Well, the five players I have selected for this first go-round are all hitters that have taken the American League Central division by storm. This division has fallen upon lean times of late as three teams are in the process of a tear-down/rebuild. At the top of the totem pole, the Twins have rather convincingly overtaken the reeling Indians at first place. Whether that keeps going remains to be seen, but there are still very interesting individual storylines to peruse here, even among the teams in the doldrums. #1: Hunter Dozier - 1B/3B - Kansas City 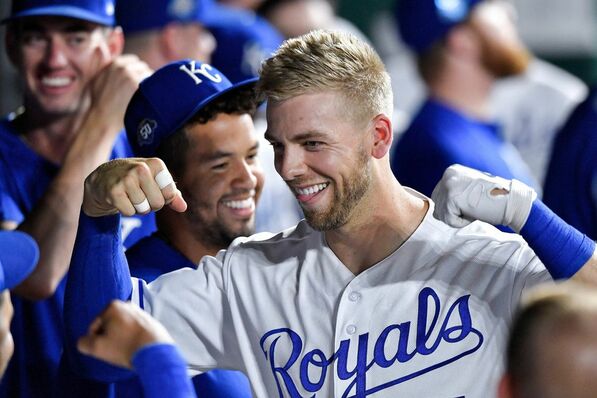 The first player of the first edition is a guy that not too many people have heard about! I love it. Dozier is a 27-year old infielder for the Royals who was a first round draft selection in 2013 by KC, going eighth overall. (That 2013 draft was a mess, but there is another 2013 first round pick in this list!) His first full season came last year, where he mustered a triple slash of .229/.278/.395 in 388 plate appearances. This averaged out to 80 wRC+ (weighted runs created plus.) ...What the hell is that? Well, I could give you the long winded explanation, but there’s no fun in that. All you need to know is that the nerds made it so that getting a 100 in this stat means that you are perfectly average offensively. Hunter here got an 80. That’s 20% below the average offensive season (100-80=20.) Pretty simple, right? Well, what’s Hunter Dozier’s wRC+ this year? 172. This is not a typo. His slash line is .318/.413/.621 at the time of writing. That adds up to a 172 wRC+, 72% better than your average season. Obviously fantastic. So the big question, the one that will pervade this series, is: what changed? Thanks to Baseball Savant, I have some answers for you. There’s a lot of ‘em. Let’s run through some real fast. He’s hitting the ball hard with more frequency and has a higher average exit velocity, so he’s hitting harder overall. He’s making contact with pitches that he swings at in the zone about 9 times out of 10. He’s chasing pitches out of the zone less. And are you ready for this part? Because this part is ART. He’s cut his strikeouts by 7.8%, from 28.1% in 2018 to 21.3% this year. He is also walking 7.8% more, from 6.2% to a whopping 14%. Isn’t that beautiful!? All of those strikeouts converted into productive walks. I’m on my peak nerd shit right now, so let’s convert these findings into hard-hitting layman’s terms. Hunter Dozier didn’t make some quick fix and figure everything out with the snap of a finger. He completely overhauled his offensive approach. He improved his plate discipline, improved his contact skills, and improved his quality of contact. He improved in about every perceivable fashion that you can track on my nerd websites. Hunter Dozier is the extreme example of achieving analytical gold out of pyrite. The other hitters here likely won’t have overhauled everything as dramatically as Hunter, but he is the benchmark for which the improvement of other subsequent hitters will be judged. Of course, he will regress, probably quite a bit, but he has definitely established himself in the early going as a name to know. #2: Yoan Moncada - 3B - Chicago White Sox 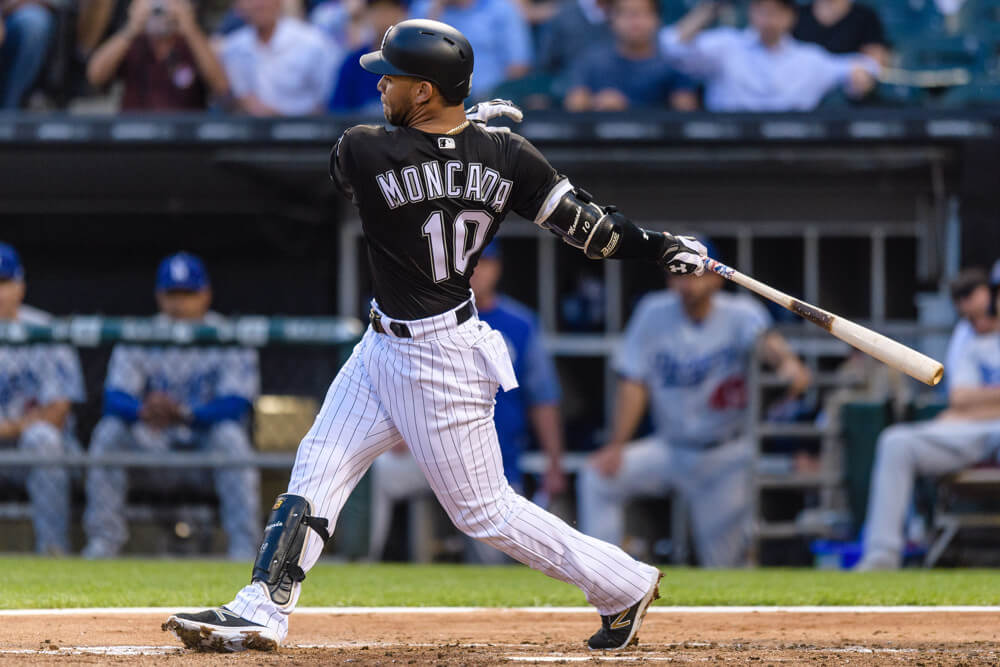 Moncada used to be a huge name for those paying attention to the talent percolating in the lower levels. Moncada, hailing from Abreus, Cuba, wasn’t just a highly regarded prospect. He was the number 1 overall name according to MLB Pipeline in 2016, ahead of names like Andrew Benintendi (#5), Ozzie Albies (#12), Gleyber Torres (#17), Aaron Judge (#22), and Cody Bellinger (#32). Yeah. This guy was a big deal. Then he came up for the White Sox in 2017, and he disappeared into the woodwork. The main reason? An obscenely high strikeout rate. The guy struck out a total of 217 times in 2018 at a rate of 33.4%. He struck out more than Chris Davis. More than anybody, for that matter. This rate of whiffing is simply unsustainable for Major League success. To put it blunty: you gotta cut it down. ...Of course, I wouldn’t be talking about this man if he hadn’t. So far in 2019, his K% is down to a FAR more palatable 26.9%. It’s a lot, but admissible in this current era of baseball where the three true outcomes rule. You don’t just achieve a .289/.349/.528 (135 wRC+) triple slash by striking out less, though. So where else has he improved? His hard hit rate has always been good (this year it’s at 45.5%, last year 44.2%), but the big boom comes in his average exit velocity. On average, he hits the ball at 93.7 mph, landing him in the top 3% of the league in that category. This improvement isn’t universal--his average launch angle and his walk rate are both down from last year--but this elite EV makes a huge difference. Then there are also some...eccentricities with Moncada’s 2018 season that should be addressed. For one, he could NOT get it done with two strikes last year. In 372 plate appearances Moncada had where the count reached two strikes, he batted .110/.212/.208. Remember all of those strikeouts, 217? That accounted for 58.3 percent of ALL of those plate appearances. Over half the time, if the count reached two strikes on Yoan Moncada, you could notch the letter "K" in the box score. But then, when you look at those strikeouts, you notice something odd. Moncada struck out looking 85 times. That is an insane amount of looking strikeouts. For reference, the hapless Chris Davis struck out looking 56 times that year, the second most. That number was bound to regress, and it has, heavily contributing to the diminished strikeout rate. Now, recently there’s been a few warning signs that Moncada’s hot start might diminish. For one, he’s been hitting a far less glorious .241/.300/.444 since the calendar flipped over to May. He'll have a to hit a little bit better than a .744 OPS to sustain his rise. Also, he’s still not hitting well at all with two strikes, and his OBP is actually down (.179/.198/.307). If he can weather these wrinkles, he will be an extremely valuable member of the White Sox lineup going forward, cashing in on the high prospect pedigree. #3: Mitch Garver - C - Minnesota Twins 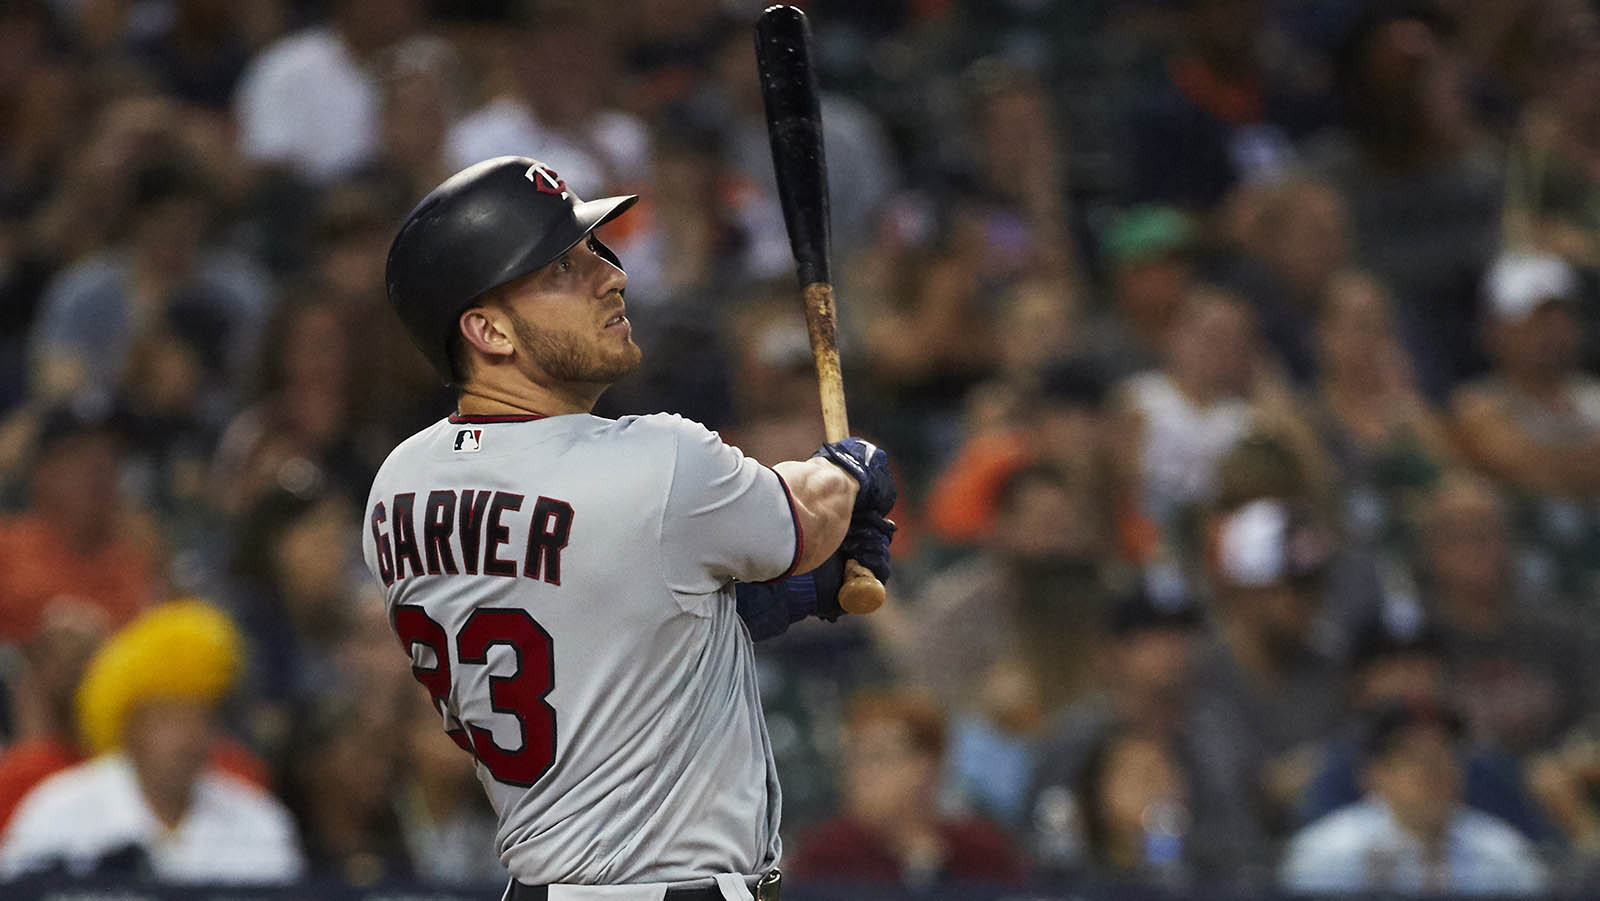 Garv Sauce is the spiciest new condiment in the victory sandwich the Twins have prepared early in the 2019 season. There are plenty of hitters the Twins can point to for their early winning ways: Eddie Rosario, Jorge Polanco, CJ Cron, and Nelson Cruz spring to mind. But Garver, the former 9th round pick, has been a huge help for the Twins, and his absolutely ludicrous early stats, whether or not they’re even remotely sustainable, are absolutely worth discussing. He has good plate discipline, with a 12.2% walk rate. In a familiar trend, his hard hit rate jetted up from 38.8% to 46.2%, and his average exit velocity increased from 88.8 to 91.4 mph. As a result, Garver has been hitting .333/.425/.733 in his first 24 games. The nature of a catcher means that he has fewer plate appearances to this point in the season than many other position players, including our boys Yoan and Hunter. But there’s absolutely real impact here; I mean, look at that triple slash again! Stop. Take a breath. Is this really happening? Is Mitch Garver really the second coming of Joe Mauer at 28? Probably not. For one, even though he crushes baseballs, he hits them on the ground 40.4% of the time. In comparison, his teammate, Jorge Polanco (1.013 OPS), is hitting balls on the ground just 26.6% of the time. Furthermore, he has a batting average on balls in play (BABIP) of .357. Can you say “due for regression?” Now, Garver’s average launch angle is a respectable 10.4 degrees, so he’s not relentlessly pounding the ball into the ground here, which is good. Furthermore, his contact skills are quite good, as is his plate discipline (just a 15.1% chase rate). So the makings of a fine hitter are definitely here and we’re seeing it play out. But are they the makings of an elite hitter à la Joe Mauer, one of the best offensive catchers of all time? I think it’s safe to assume not. Still, he’s fun to watch and he even occasionally leads off in the batting order! A leadoff catcher...makes sense if he’s get a .425 OBP. I like what Rocco Baldelli’s doing over there. 4. Tim Anderson - SS - Chicago White Sox 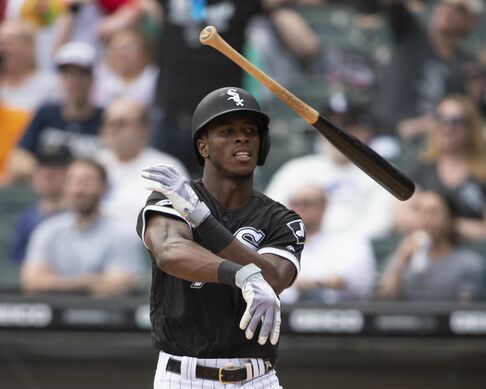 It's hard to compile a list of top unexpected performers in the AL Central without discussing the man who took home honors for the AL's Player of the Month in April. That man is Tim Anderson. Love him or hate him (I love him), he is bringing a big splash of personality to the South Side that we haven't seen in a while. And he's doing so with much improved offensive numbers. Anderson, the other 2013 first round pick in this list, is slashing .322/.353/.521 (136 wRC+), an over 50% percent improvement from last year's meager .240/.281/.406 (85 wRC+) line. How did he do it? You'll find some familiar answers. Hard hit rate increased! A feeble 27.9% has jumped to a far more robust 42.6%. While he doesn't actually hit the ball all that hard on average, possessing a 43rd percentile exit velocity, getting it to tick above 95 as much as he has generates results. And his EV is also up, from 85.6 mph to 88.7. But above all that, the dude's hit into some good luck this year. His batting average on balls in play is a wacky .365, and a 28.8 mph average sprint speed will help that out. The rest of his peripherals aren't terribly flattering. He walks less than 4% of the time and he chases a lot. I'll go on a bit of a tangent to introduce one more weird stat here, and that's called xwOBA. It's a very important stat, one I'll rely upon heavily when analyzing players. It's one of a litany of "expected" stats that Baseball Savant employs. I'll let Savant themselves explain to you how they work.  You see there that xwOBA stands for expected weighted on base. How does it work? Well, on April 14th, Tigers outfielder Christin Stewart hit a long ball to center at Target Field against the Twins. It left that bat at 104 mph at a launch angle of 24 degrees. Statcast data says a ball hit like that has an expected batting average of .940. And Byron Buxton caught it. Bummer for Stewart, right? Well, xwOBA still rewarded him for it because without Buxton's elite defense, that's an extra base hit. It's an awesome statistic that rewards hitting the ball well. It's great for finding players who have not done well so far but should break out soon. ...And vice versa. Tim Anderson's xwOBA is .337, which slots into the 57th percentile of the entire league. It's above average, but it's nothing to write home about, which indicates that Anderson may soon see a drop in his stats. It's not foolproof, but it tends to work to the point where the biggest overperformers' wOBA are only above their xwOBA by about 30 points at season's end. One last thing for clarification...wOBA and its expected counterpart also have this thing where different results from making contact are valued differently. Home runs are more valuable than triples which are more valuable than doubles which are more valuable than singles. Strikeouts, walks, and HBPs do not impact this stat. So, xwOBA sees Anderson as due for regression. But the dude's just so darn fun to watch, I want to see him defy the peripherals as long as possible. P.S. The bat flipping controversy is stupid. Don't give up the home run next time, Brad. #5: Ronny Rodriguez - IF - Detroit Tigers 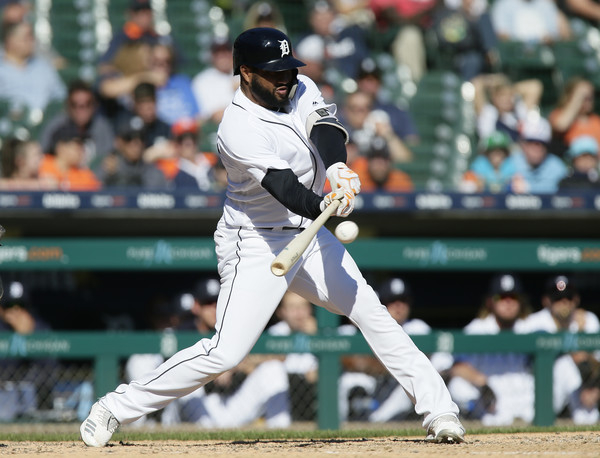 The rise of Ronny Rodriguez was so sudden and so unexpected that when I planned this out a mere week ago he was not in the plans as one of the players I would be talking about. Then he started mashing, and I realized he was perfect as the final spot and as a representative of the Tigers. Rodriguez is very much still susceptible to the small sample size asterisk, as he only has 20 games to his name in 2019. What a 20 games it's been, though. He's hitting .301/.350/.658 (161 wRC+) with 5 homers and 12 RBI in 80 plate appearances. His xwOBA is a sterling .386, and he's got himself a 44.8% hard hit rate.
So, fine. Dude's crushing. Could be anyone over 20 games. But I want to know is where this guy came from and if there's any way to know if he can sustain this production. So who are you anyway, Ronny Rodriguez? Ronny Rodriguez was signed as an international free agent out of the Dominican Republic by the Cleveland Indians on October 5th, 2010. There he percolated in the minors for years while making some brief cameos at Spring Training. He never got the call, and seven years later, on November 6, 2017, he was elected free agency without a single MLB game on his resume. He was starting to hit well at AAA Columbus, though, with a 114 wRC+ in 117 games. Eventually on December 21st, 2017, Ronny signed a minor league free agent deal with Detroit. Rodriguez tore it up in his first MiLB season in Toledo with the Tigers, hitting .338/.365/.558 (158 wRC+) in 63 games before earning a callup to The Show. It was far from glorious. Rodriguez looked overmatched, mustering just a .591 OPS in 62 games with the 98-loss Tigers. He batted similarly poorly in Spring Training and did not make the Opening Day roster. But when Jordy Mercer hit the IL with a right quad strain, Rodriguez was called up. He's been up in the Majors ever since, and for now is a mandatory addition to the lineup for manager Ron Gardenhire. He is positionally versatile and can play any infield position, but is mostly playing shortstop, Mercer's vacated position. So can he keep it up? Well, it's tough to say. It's important to note that expected stats do like him quite a lot (we mentioned his xwOBA, but his expected slugging percentage, or xSLG, is .563). But he's a bit of a soft contact guy, with an average EV of 88.8 mph. His plate discipline appears to be solid. His numbers against the shift don't reveal much, nor do his numbers against specific pitches, though he has a bit of trouble against breaking pitches. It's all just waiting to see more of him. As the Tigers are currently a bit lacking in talent on the farm outside of the illustrious Casey Mize, it would be awesome to see a guy like Rodriguez, at 27, breaking out into form as a legitimate piece in a lineup without a lot of permanent fixtures. PHEW! All done! Wow, that was a lot. Maybe I could consider trimming down next time. Regardless, this has been the inaugural iteration of Persons of Interest. Thanks for reading! Feel free to comment down below. I'm not quite sure how the comment section works but you can probably figure it out. You're smart. I know this because you're reading this. HA! Alright, that's enough from me. This is Jeremy, signing off. Hey there, it's Jeremy! Just wanted to say hi!This is officially my first blog post, and it's really here just to say "hey" to you! I'm ready to hit the ground running with baseball content, but this post is just here to have something nice for you to look at while you quiver with anticipation. I know, it's so exciting. Well, I still gotta work on it all, but I promise my first big real baseball-related post will be out shortly. It's the start of a series I'm working on called Persons of Interest. I think you'll like it. If you're hoping to get into the more analytical side of baseball, it'll help. That's currently in the shop right now, so keep a look out! And hey, why not give a little look around to see what I've cobbled together so far! I promise, it'll be far less barren soon! -Jeremy 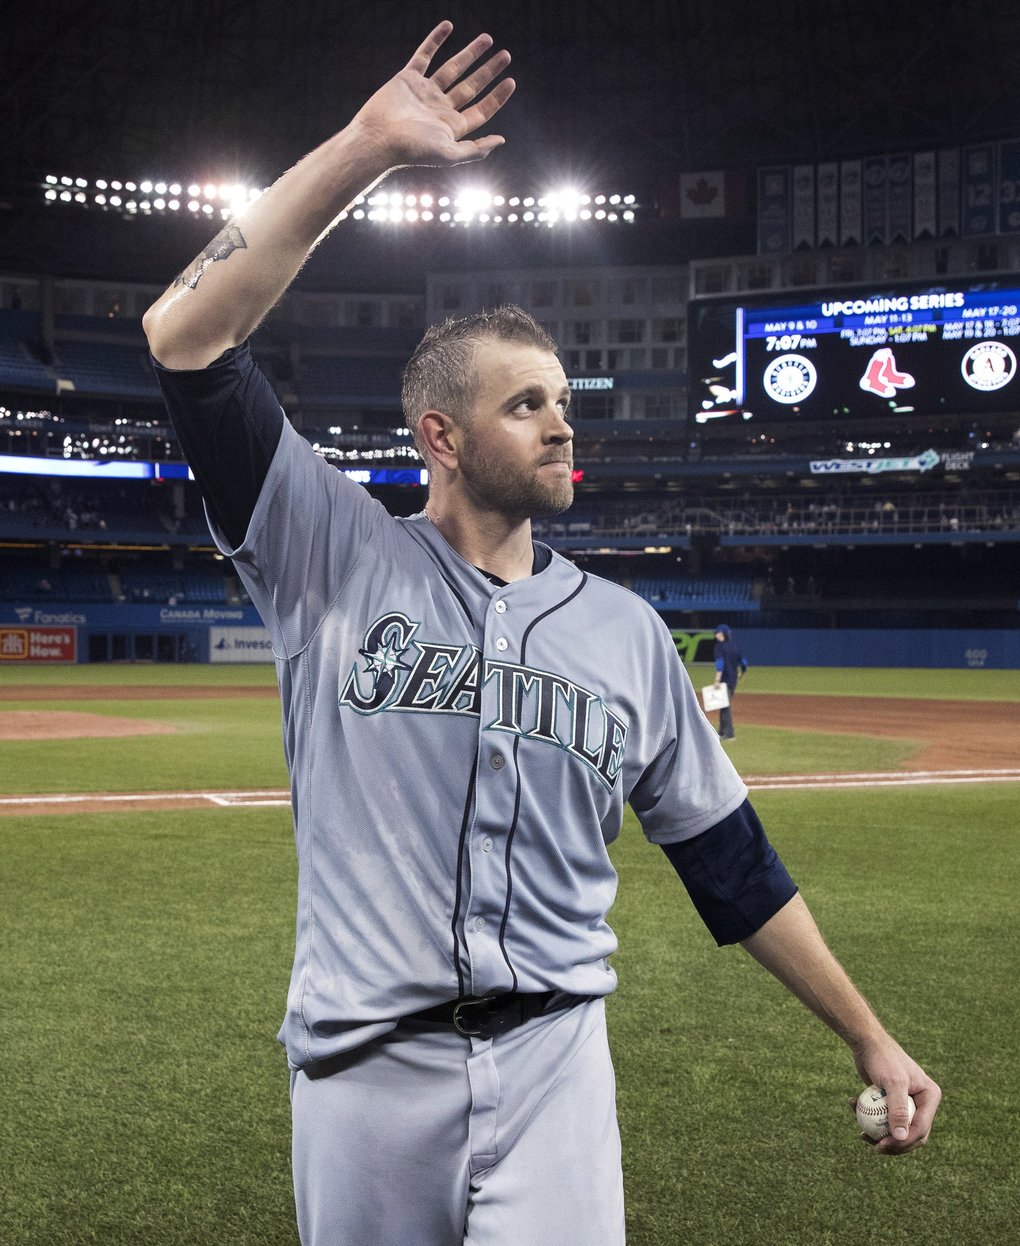 It's James Paxton acknowledging the crowd after his no-hitter! Just as I am acknowledging you, the reader, for stopping by this blog.
|
About MeI'm Jeremy, and I like baseball. Watching it and writing about it mainly. This is where the latter goes. My other hobbies include video games, singing, biking, and slacking off. I live in New Jersey and go to school at Goucher College in Baltimore. 
That's me on TV! If you want a better look, check out this video. Watch the stands on Kyle Lewis' home run very closely. Look for the skinny guy with the Yankees hat.
Archives
June 2020
Categories |
 RSS Feed
